Monitoring Sudan’s artisanal and small scale gold mining from space
Published: November 2025 · Categories: Publications, Sudan
Gold is helping fuel the war in Sudan, and its extraction is causing environmental degradation and chemical pollution that threatens human health. In this report, Jonathan Walsh investigates whether open-source remote sensing can help us track Sudan’s artisanal gold mines.
Introduction
Following the secession of South Sudan in 2011, and the subsequent loss of 75% of its oil reserves and 90% of foreign exchange earnings, the Sudanese economy was in crisis. With rising inflation and unemployment, many young men were pushed towards artisanal mining of the country’s gold reserves to earn a living. An informal method of extracting gold, miners use basic or improvised tools, often working on unstable and unsafe mining seams.
Rather than strictly regulate its uptake, Sudan’s former president had granted mining concessions to the military groups that sought to control gold-rich areas. In the following years, artisanal mining expanded rapidly. The outbreak of conflict in 2023 was driven in part by competition for gold reserves between the SAF and RSF, and the conflict has only further incentivised its growth, with both using foreign sales of regular and artisanally-mined gold to fund their war efforts.
Although some recent research is available, the conflict has limited the ability of researchers to undertake field research, identify health and environmental risks, and assess remediation priorities. Remote satellite observations could be useful to fill some of this knowledge gap, to help quantify the scale of the problem, and to monitor its spread across time and space.
Widespread artisanal mining in eastern Sudan
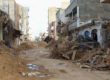
One area that has reportedly had high levels of artisanal mining expansion in recent years is to the east of the River Nile. From al-Butana, all the way up to River Nile and Red Sea states, vast expanses of desert are covered in deep scarring associated with artisanal mining. Here, mining is ultimately controlled by the SAF, and is additionally fuelled by an influx of IDPs, largely from Khartoum and Al Jazirah states where fighting has been intense, as well as migrants from Ethiopia and Eritrea.
The environmental impacts are manifold; physically, mining substantially alters the soil structure and geomorphology of the land. As surface layers of soil, and in some cases trees and vegetation are removed, the land becomes more vulnerable to erosion and subsidence, especially as rainfall becomes more sporadic and intense in the changing climate. In turn, this impacts key ecosystem services such as natural drainage, and the seasonal agricultural function the land provides to pastoralist communities.
Using moisture differences to detect mine tailings
We can use the arid landscape of eastern Sudan to our advantage when deciding which remote sensing methods to use to detect artisanal mines. The Sentinel-2 satellite captures reflected light from far beyond the visible portion of the electromagnetic spectrum, from the near infrared to the short wave infrared range. Every feature on Earth absorbs and reflects light along this spectrum at different rates, creating what is called a ‘spectral signature’, with many of the distinguishing features of a spectral signature occurring outside of the visible range.
Moisture differences created by artisanal mines are starkly different in their spectral signatures to bare soil during the dry season in much of eastern Sudan. Applying water-detecting indices to this data gives us a number for each pixel ranging from -1 to 1, where anything over 0.3 is likely water, and anything approaching that is likely more moist land cover.

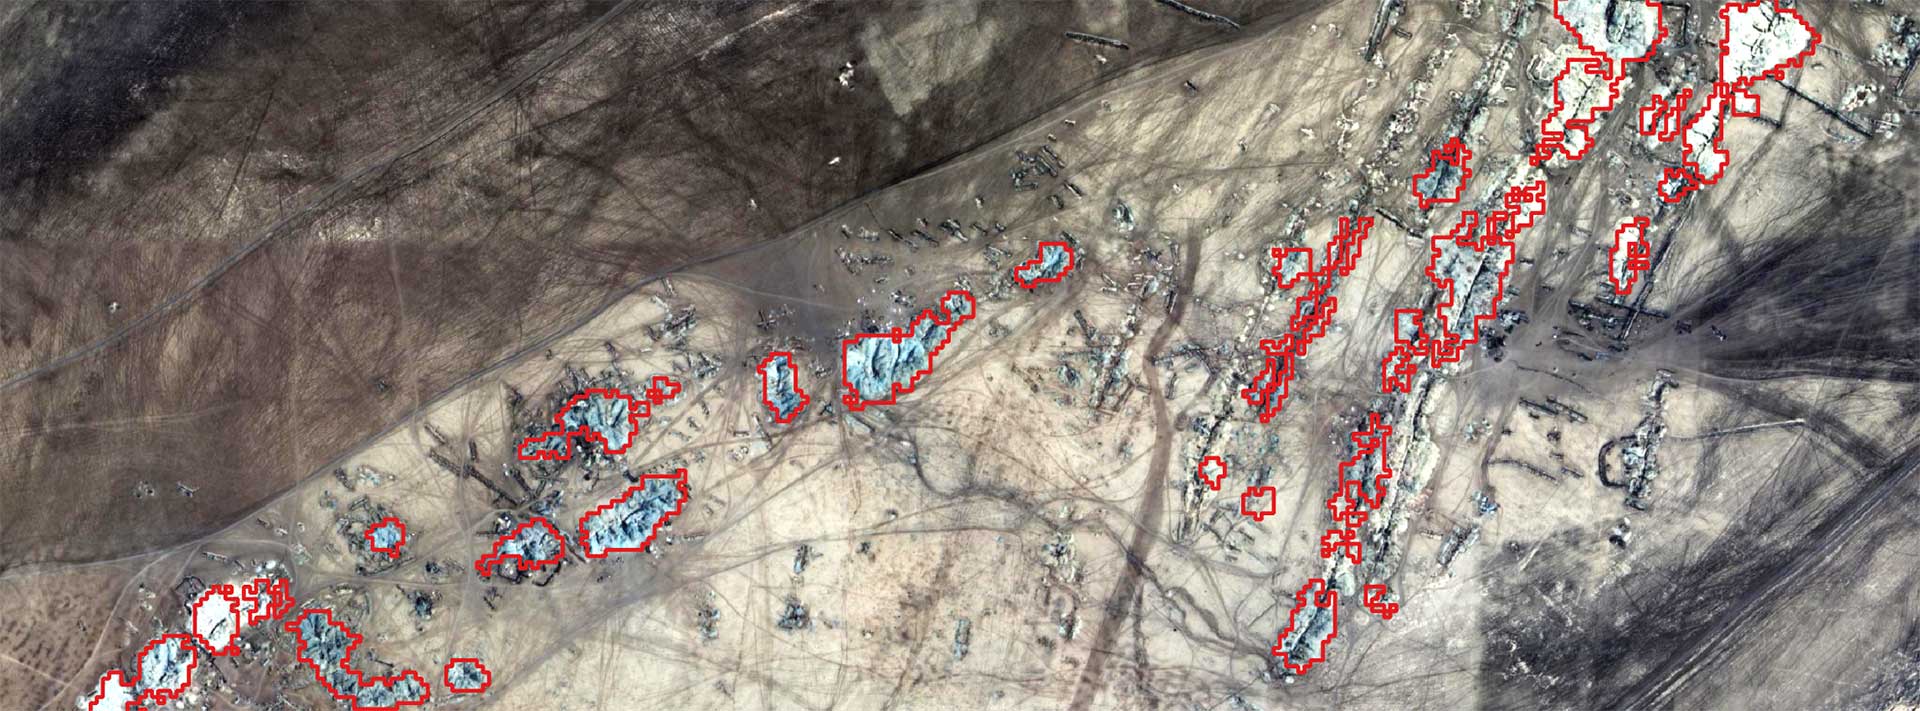
In al-Butana, where the soil type is predominantly clay-based, these differences are especially pronounced. Applying machine learning methods on our moisture-detecting spectral index suggests that large areas of Butana are impacted by artisanal mines. Much of this occurs across very long mining seams, such as the one in the figure above, which stretches 23 km. Interestingly, applying this method on imagery from 2019-2025 suggests only a minimal increase in the overall area of artisanal mining in al-Butana since the outbreak of the conflict, although area alone is not a perfect proxy for activity.
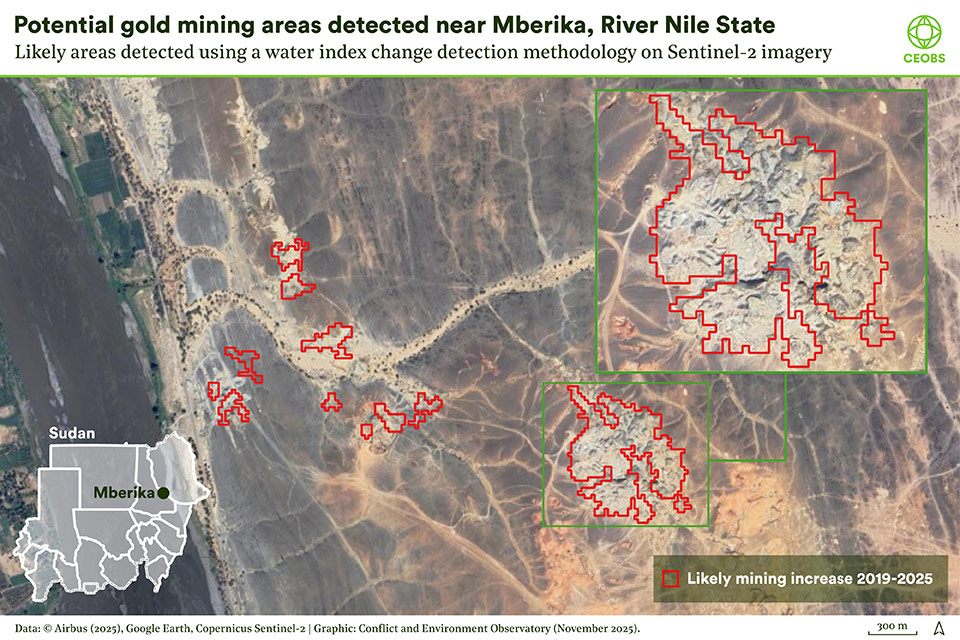
Further north in River Nile and Red Sea states the sandier soil makes these moisture differences less pronounced and, along with a slightly more uneven surface, leads to more false positive detections. Nevertheless, a simple moisture change detection method applied to composite images from the early months of 2019, 2023, and 2025 appears effective at identifying the areas of greatest change, and reveals that vast areas of mining have remained active during the conflict. Similar to al-Butana, these mines are located in largely rural areas in Red Sea State, but in River Nile State many artisanal mines are located close to towns, from Alabediah up to Mberika that sit along the Nile itself.
Risks from toxic tailings
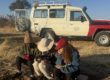
Once gold is mined, artisanal miners crush the ore and apply toxic mercury to create an amalgam. The amalgam is then heated — commonly with a torch or on a stove — to evaporate the mercury and recover the gold, usually with little protective equipment. This process frequently takes place in densely populated mining camps around mills and their markets, and where miners live with their families. Where the term mills markets is used in this post it denotes these informal agglomerations of worker camps, gold mills and markets.
Mercury is one of the most toxic, persistent, and bioaccumulative of all heavy metals. Exposure from breathing mercury vapour, oral consumption, or dermal contact can damage the lungs, kidneys and nervous system, and is also linked to longer-term neurological conditions. Vapour may also be suspended in the atmosphere, travelling long distances before being deposited. Recent studies have found that airborne mercury from Nigerian gold mines had contaminated nearby crops.
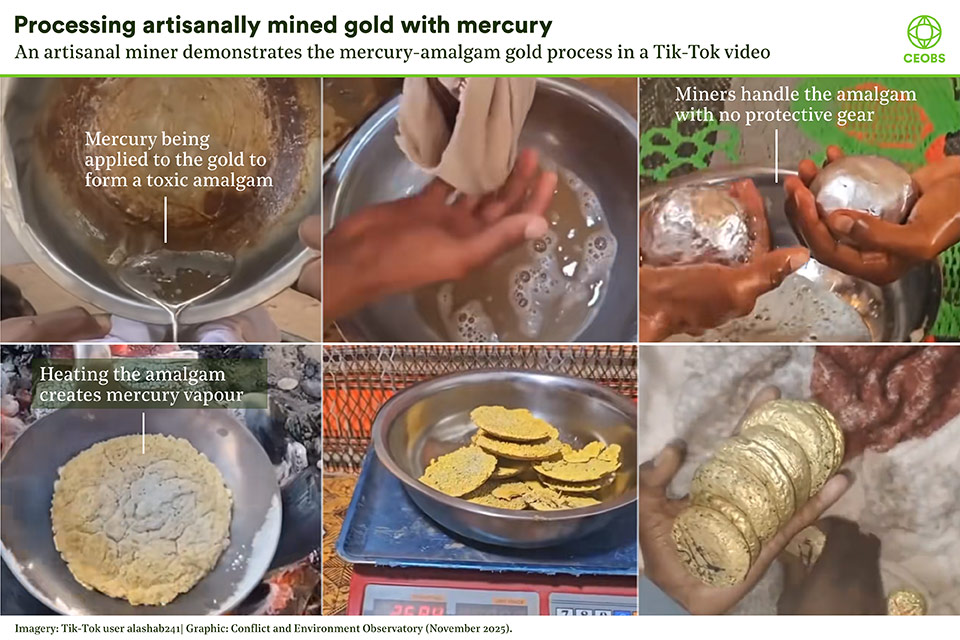
Only around 30% of gold is extracted by the amalgamation process, with small and larger companies taking the residual tailings, which are known as karta. Cyanide is used to extract the remaining gold from karta through immersion in open-air treatment ponds. Tailings can also be seen piled up around mills markets, and because of the inefficiency of the amalgamation process, these can still contain large quantities of mercury.
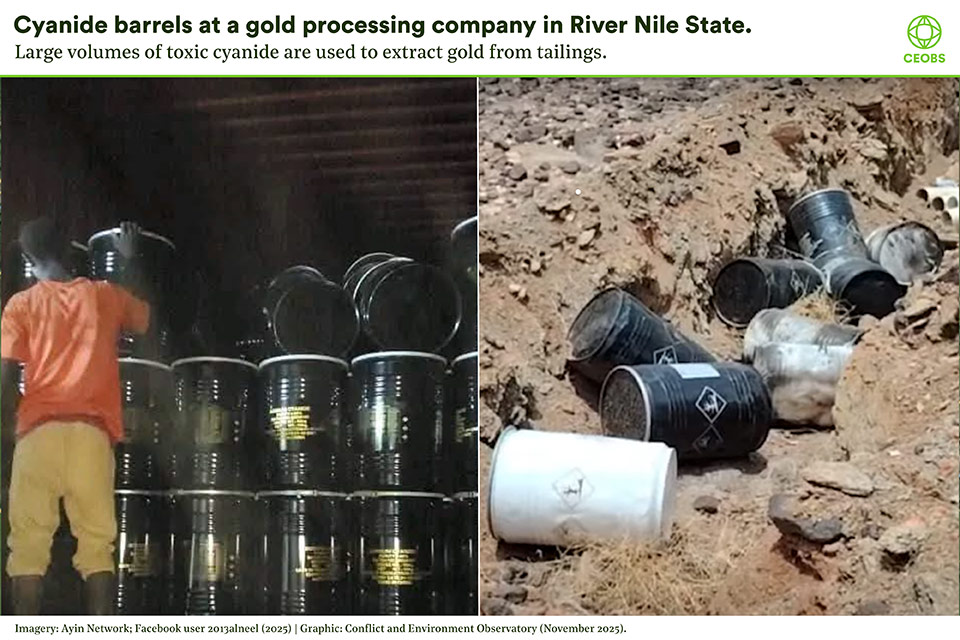
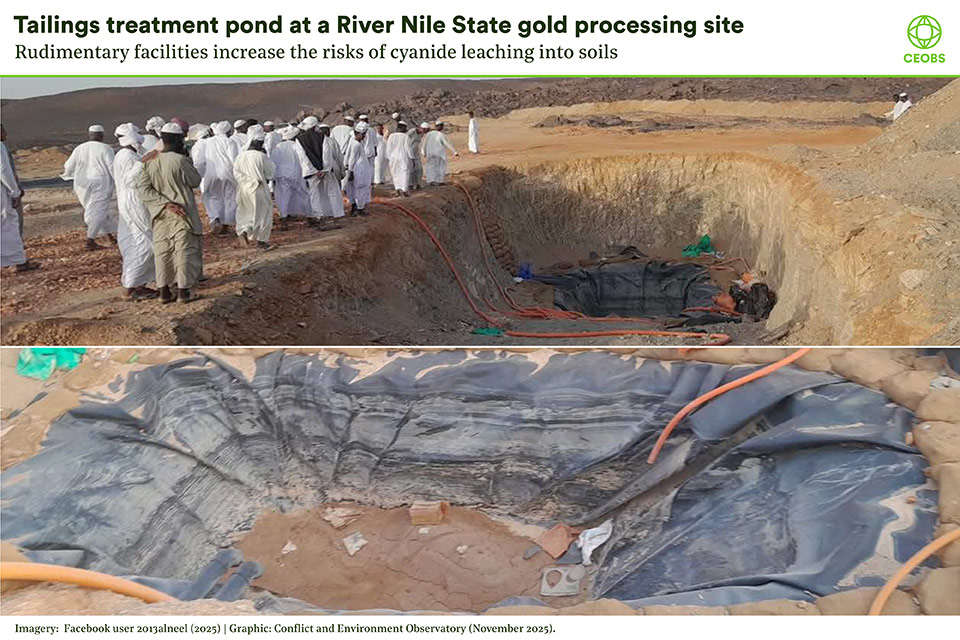
Improper construction and inadequate management of tailings piles and treatment ponds, whether at mills markets or mines, allows both cyanide and mercury to infiltrate and persist for years in sediments and groundwater. Major flood events are already becoming a more regular occurrence across Sudan, especially along the River Nile, resuspending these dangerous contaminants and allowing their reach to be far wider and more unpredictable. Contamination of water and soils not only impacts human health, but also aquatic and terrestrial ecosystems.
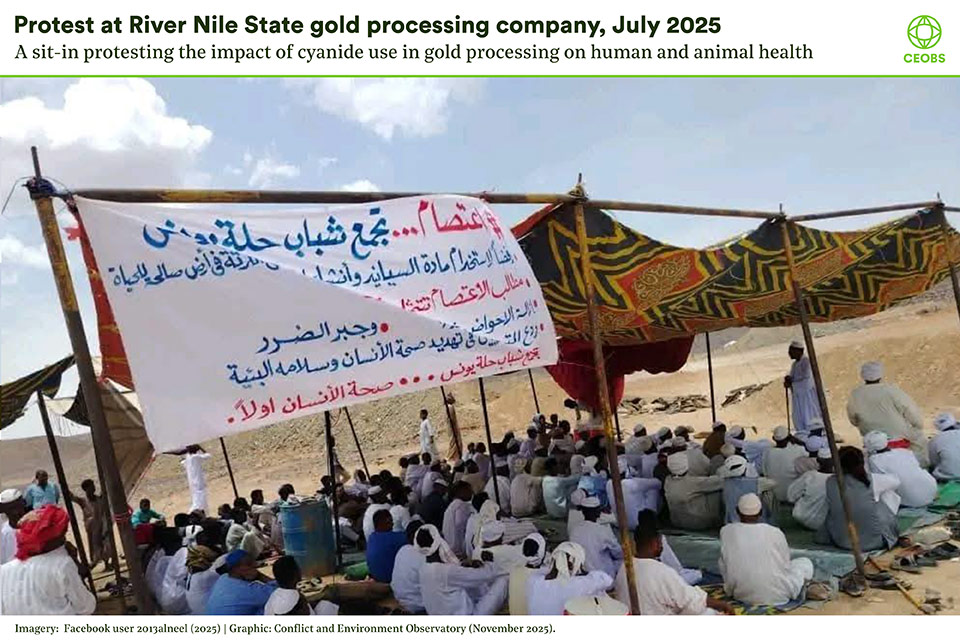
Although a signatory, Sudan has not ratified the Minamata Convention on Mercury, an agreement that addresses human activities that generate mercury pollution. Nor does it enforce a 2019 agreement to ban the use of cyanide and mercury, which came about as a result of widespread public protests against the risks to human health. These protests are still ongoing, including sit-ins at mining companies near Berber, River Nile State in July 2025, which led to the removal of some cyanide treatment ponds.
Other proxies for detecting gold mining
During the mine detection process, several gold processing companies and mills markets were located. Gold processing company sites are identifiable by their treatment ponds, which show up as larger geometric shapes than the smaller more irregular treatment ponds visible in mills markets in Very High Resolution imagery. We can use the same water detecting index as before, albeit with a higher threshold, to detect patterns in these water-containing ponds, with the hypothesis being that broad trends in levels of activity at a site are related to the amounts of water being detected.
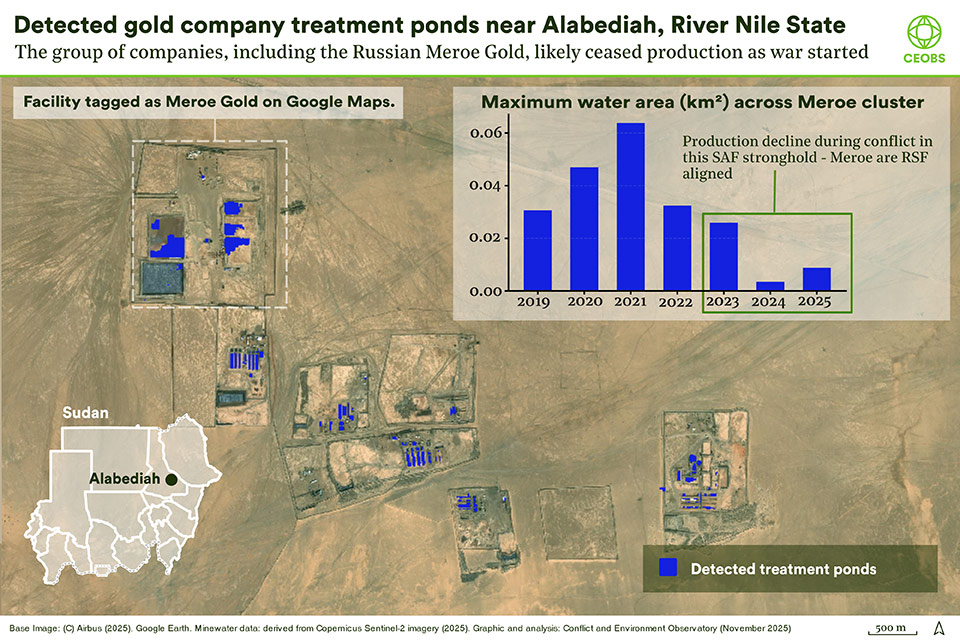
Across River Nile and Red Sea states, three locations were identified, each showing different trends in activity. The first — which according to a tag on Google Maps is run by the RIDA Mining Company — appears to be consistently active from 2019 to 2025, while the second, a large cluster of sites run by multiple companies including Meroe — the Russian/Wagner-linked mining company with links to the RSF — appears to have ceased production shortly after the current conflict began out in 2023. A third, smaller site with no company name attached to it shows increasing levels of activity since it opened in 2020.
The expansion of the highly environmentally risky mills markets is harder to quantify. Visually their growth is clear, but as with many informal settlements, their activity is harder to quantify remotely, and may not be linearly related to their expansion of their boundaries.
Potential for further research
Even within the limited scope of this research post, open source remotely sensed data has demonstrated potential to provide valuable additional insights into where artisanal and small-scale gold mining is most prevalent in Sudan, as well as the patterns of its spread and the likely environmental risks in different locations.
Attempts to reproduce the methods outlined above in the west of the country around the Jebel Amer and Al Junaid sites, which are controlled by the RSF, proved less insightful, and the differences in success of each method signals how difficult it is to develop robust detection models over vast areas. This is largely driven by differences in land use, soil types and political contexts across Sudan, and suggests that it’s not possible to make a one size fits all approach.
Some of the key questions future remote sensing research could investigate include the patterns of activity at mills markets, and identifying the risks from mercury contaminated tailings, discerning where they are and what the future flood risks are in those areas as the climate becomes more volatile. Although the task of identifying the mines themselves is an important component of understanding the overall problem, answering these additional questions will help clarify the environmental risks that Sudan faces from artisanal and small-scale gold mining, especially around the mismanagement of mercury and cyanide use.
Jonathan Walsh is a Researcher at CEOBS. Our thanks to Hussein Sulieman at the Global Development Institute, University of Manchester, and to Tasneem Sied Ahmed for their contributions to this research. If you find our work useful, please consider making a donation so that we can continue it.
Methodology
Gold mining area detection
The method for detecting possible artisanal gold mining areas, here deployed in al-Butana, was completed by applying a Normalised Differenced Water Index (NDWI) to Sentinel-2 imagery in Google Earth Engine (GEE). Mean composites were created from cloud free images outside of the rainy season for the target year(s), and training sets were built from a mixture of Very High Resolution satellite imagery, and OpenStreetMap (OSM)/Wikimapia data on land use, detecting three land use types: desert, buildings, and mines. A Random Forest machine learning classification was applied on the training set to produce a land use classification, which was then exported, and opened in QGIS, where it was sieved to remove pixels with few contiguous neighbours (likely noise). As some populated areas were still detected as mines, at this stage it is recommended to open the Global Human Settlement Layer (GHSL) to visually analyse the areas with the largest mining impacts.
Gold mining change detection
This methodology, used in River Nile State, includes applying an NDWI to Sentinel-2 imagery in GEE, again building mean composites from cloud free images outside of the rainy season for the target years. At this stage, band mathematics were used to highlight the expansion of mining sites between the baseline and target years. Comparisons with available high resolution and VHR data determined the best change level to identify change without introducing likely false-positives. In this study, an index score change of -0.075 was determined to be the most effective. Again, the data was exported to QGIS, sieved to remove pixels with few contiguous neighbours, and visual analysis was carried out alongside GHSL data.
Mine company detection
This process was done entirely in Google Earth Engine, again applying an NDWI to Sentinel-2 imagery, filtering cloud free images outside of the rainy season for the target years. A pixel-wise highest NDWI pixel was then applied to find the highest value NDWI pixels across each year, and then filtered to include only those pixels with an index value over 0.3. Relevant mine company sites were determined by the geometric shapes of the water bodies, and looking at their land use and nearby land use on Google Maps, Wikimapia, and OSM.