Mapping the vulnerability of Ukraine’s groundwater
Published: September, 2024 · Categories: Publications, Ukraine

CEOBS has been tracking and remotely assessing environmentally-relevant incidents in Ukraine since the start of the full-scale invasion. These assessments form part of our ever growing incident database. As part of a process of continual refinement of our remote assessment methodology, we frequently integrate new features and tools, for example a comprehensive digital map of ecologically important areas. Our latest project has been to map how vulnerable Ukraine’s groundwater is to pollution caused by the conflict.
Contents
Introduction
Groundwater accounts for around 99% of the liquid freshwater on Earth. However, it is often undervalued and environmental damage goes unrecorded, partly because it is hidden from view. The 2022 edition of the United Nations World Water Development Report was entitled ‘Groundwater: Making the invisible visible’, which describes the challenges and opportunities associated with groundwater development.
In Ukraine, as in all countries, a comprehensive understanding of groundwater quality is essential to ensure clean freshwater is available for drinking, for irrigation, for critical infrastructure and for the maintenance of ecologically important areas like wetlands. Since the full-scale invasion in February 2022, the environmental damage has been widespread and relentless.
Damage to urban areas and to energy, industrial and agricultural sites has led to chemical pollutant runoff and the potential infiltration into groundwater. Other pollutant sources include toxic remnants from the intensive use of ordnance and leaks and discharges caused by a lack of infrastructure maintenance, such as mine tailings dams, and acid mine drainage from closed or de-energised coal mines.
Understanding groundwater vulnerability
What is groundwater vulnerability?
An aquifer is a layer of rock that stores groundwater in either pores or fractures. The rate at which water flows from and within this layer depends on the aquifer’s permeability – permeability is also a key factor for whether pollutants can flow into an aquifer and contaminate the water in it.
The impacts of pollution on aquifers differ greatly depending on their physical properties – such as permeability – and the surrounding environment; some are inherently more exposed to pollutants than others. Groundwater vulnerability is a way of measuring how easy or difficult it is for contaminants at the land surface to migrate and reach the water table, which is typically the top of an aquifer.
Remote assessments of groundwater vulnerability do not generally consider the nature of specific contaminants, their concentrations, or how quickly they may disperse or break down in the environment. To answer these questions it is necessary to undertake field sampling, which can also be done in combination with environmental modelling.
How do we model groundwater vulnerability?
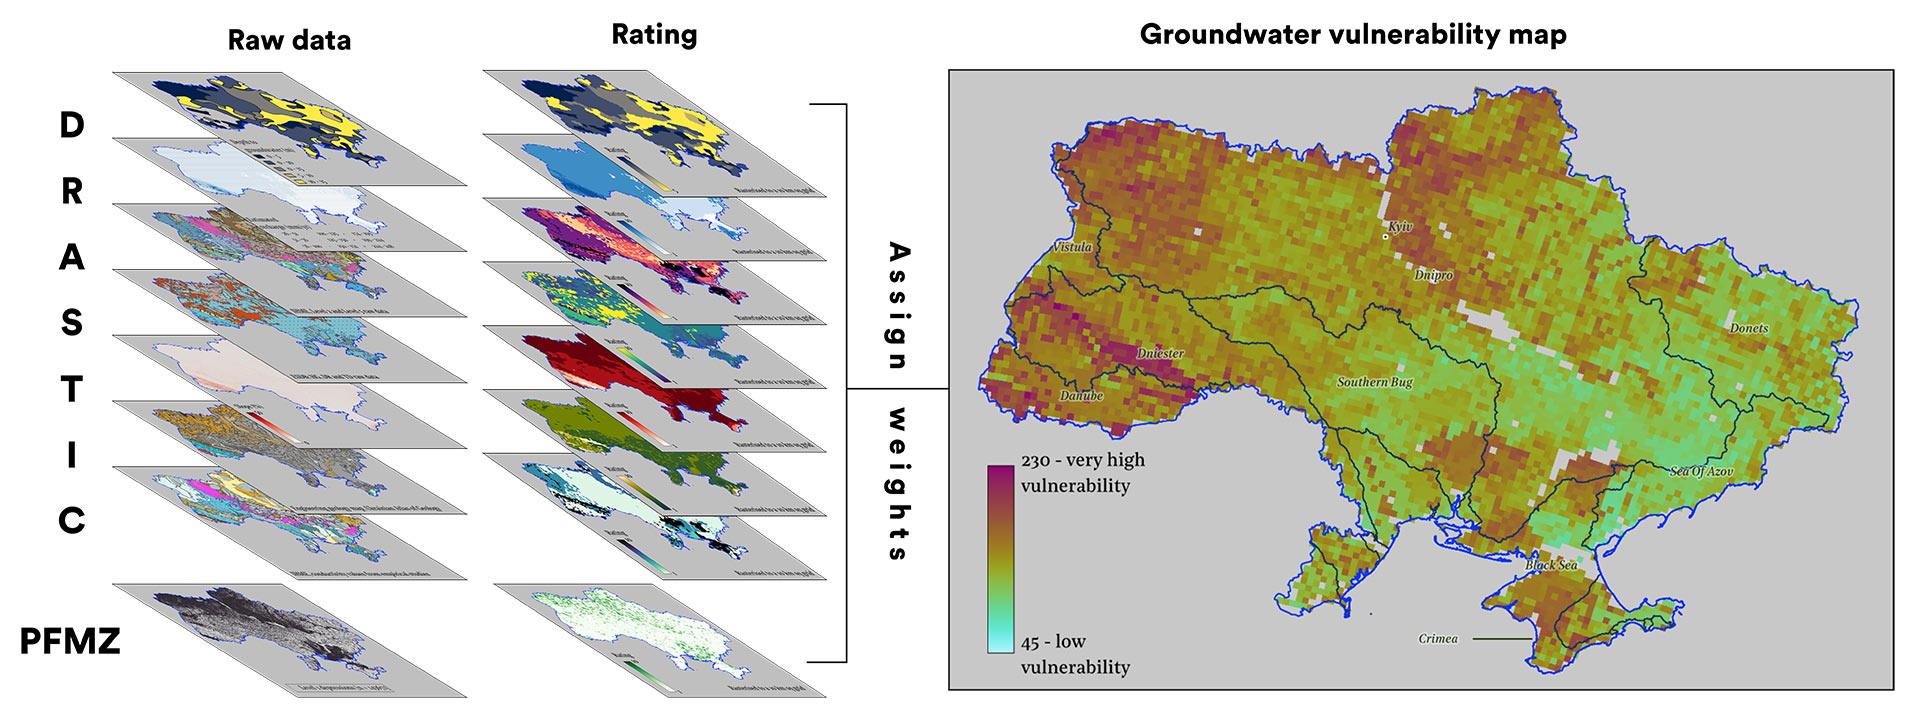
We have used a desk-based approach to generate a national-scale groundwater vulnerability map of Ukraine. We have done this using a model known as DRASTIC, which was developed by the US Environmental Protection Agency. Groundwater vulnerability is defined by a relative scale (very high, high, medium and low) based on an index that is calculated from the best available open-source datasets.
The letters in the DRASTIC acronym represent the model inputs in the groundwater vulnerability assessment. These are:
-
-
- (D): Depth to groundwater;
- (R): Recharge (water replenishment of the aquifer);
- (A): Aquifer rock type;
- (S): Soil type;
- (T): Topographic slope;
- (I): Impact of the uppermost rock types (water will pass through these before reaching the aquifer);
- (C): Hydraulic conductivity (how easily water flows through the aquifer rocks).
-
These inputs are assigned a rating from 1-10 and a weighting from 1-5, with low numbers indicating lower risk and higher numbers indicating elevated risk. The weighting is fixed for each input for a given model run, and determines the importance attributed to that input. Generally, the depth to groundwater and the recharge are the most important model inputs, while topographic slope is generally the least important. The rating for each input varies according to the ground conditions in a given area. For instance, aquifers formed in shales have a low ‘A’ rating as shales are relatively difficult for water to flow through, whilst karstic limestone have the highest ‘A’ rating as flow can occur through cracks and caves very rapidly.
Our study combines open-source datasets to characterise areas on a 10 x 10 km scale. To our knowledge, this has not been conducted for the entire country before. It is possible to produce a higher resolution model with the data and methods that we are using, but we chose to limit our analysis due to security considerations around the subsoil environment and groundwater in Ukraine at the present time.
What is the purpose of a groundwater vulnerability assessment?
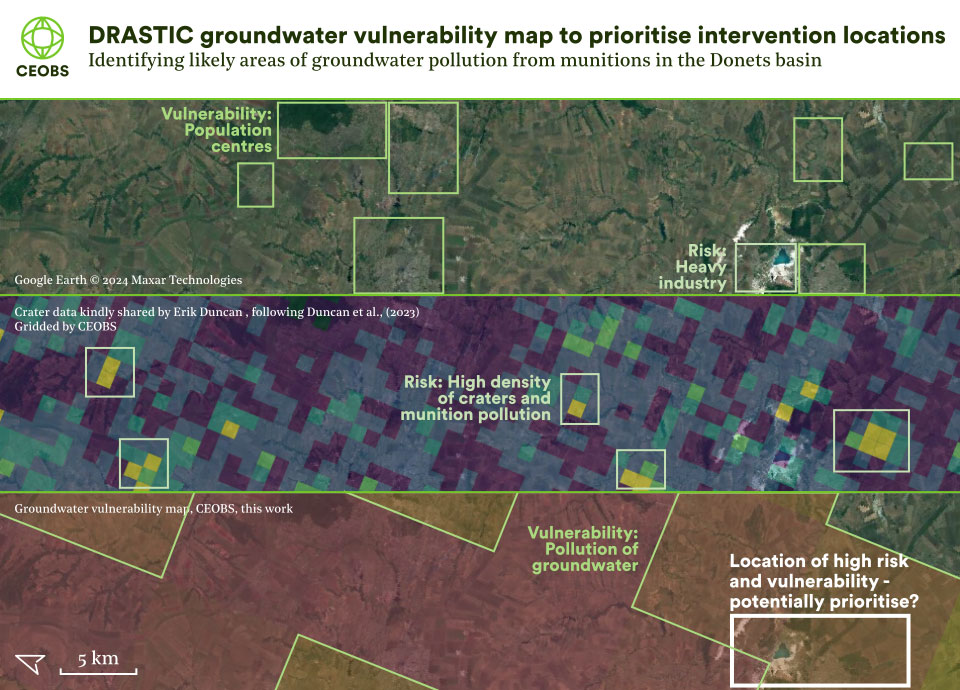
The primary aim is to identify current and future pollution exposure risks from the use of groundwater. Many parts of Ukraine are not connected to centralised water supplies and are reliant on local water wells, attacks on energy and water infrastructure have increased this reliance in many areas. For example, UNICEF and its partners drilled wells for a number of hospitals in Odessa and Mykolaiv due to intermittent supply. When combined with knowledge of legacy and conflict pollution incidents, population locations and water supply status, the groundwater vulnerability map can help identify potential exposure hotspots and help water managers plan accordingly.
What we found and how we are using it
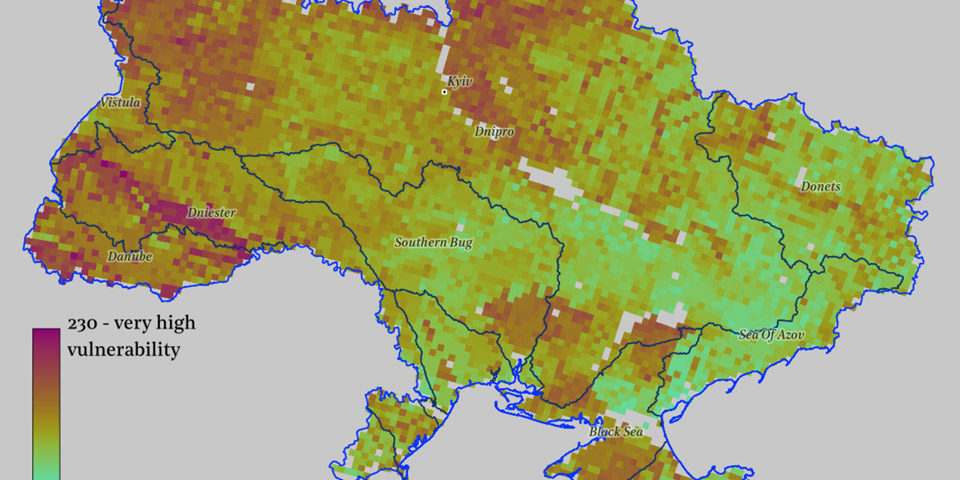
The figure below is a simplified schematic showing how the DRASTIC modelling process uses different data layers, alongside the resulting national groundwater vulnerability map. The map reflects the distribution of certain hydrogeological conditions across Ukraine. This includes karstified rocks – carbonate rocks such as limestones that have been brought to the surface and eroded by rainfall and other processes.
Their presence across much of the upper Dniester basin, parts of the Donets basin, the Danube basin, large parts of Crimea and parts of the lower Dnipro basin means that groundwater in these areas has a very high vulnerability. Elsewhere, the Dnipro basin has the highest density of topographic depressions, this leads to elevated vulnerability to the north, east and west of Kyiv. As might be expected, gaps in the data arise where large surface water bodies are present, such as those along the River Dnipro.

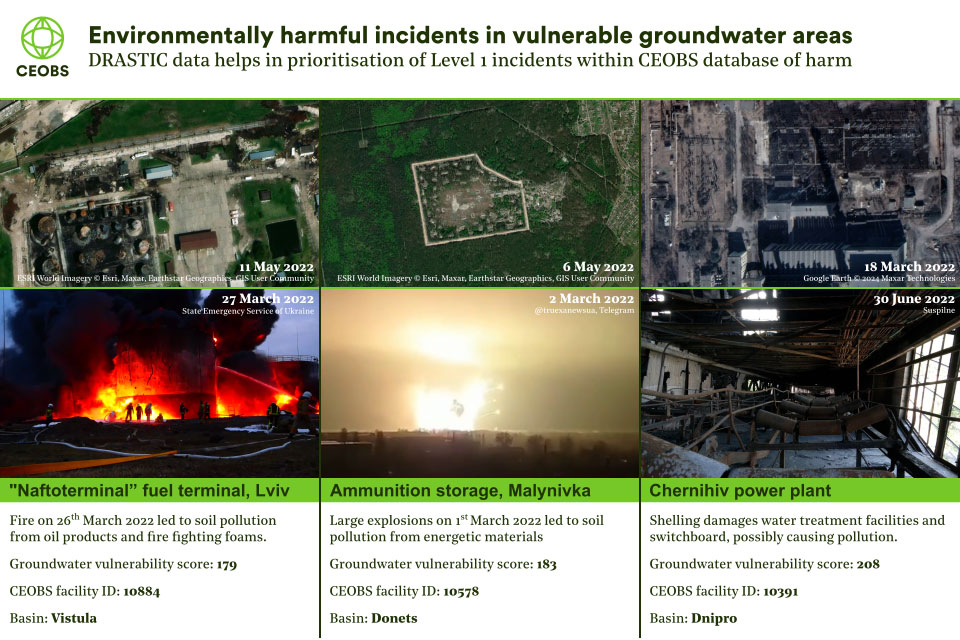
The groundwater vulnerability map we have created is now used as an important data source for the CEOBS database of environmentally problematic incidents caused by the war – you can explore 25 of the 2,000+ incidents on our interactive map. Our work on the database is supported by partners including UNEP and the OSCE.
When our team remotely analyses incidents, the groundwater vulnerability score is combined with other parameters, such as the location and type of facility, to calculate a theoretical harm score for the incident. Our analysts then examine all the open source evidence that they can in order to determine the magnitude of the incident, ending up with an environmental risk score. This is used to identify the priority sites for ground interventions.
With the national map done, we hope to conduct more localised research when higher resolution datasets are available. One priority will be groundwater vulnerability assessments near facilities with a high-polluting potential, such as those previously undertaken at the Chornobyl Nuclear Power Plant.

Limitations and next steps
Modelling groundwater vulnerability at the national level using datasets gathered at the continental level places limits on how detailed the model can be. Although we used the best available sources covering the entire country at the time of writing, more recent and detailed information about the subsurface geology, and the depth to groundwater especially, would improve the reliability of our modelling.1 In addition, there are further sources of data that could be usefully incorporated into the model in the future, such as maps of land use/land cover, geological lineaments and fractures, and more detailed mapping of deeper aquifers and their relationship to the upper aquifers.2

We see this groundwater vulnerability map as a ‘first version’ and are very open to developing our approach further. In particular, we foresee significant potential in working with people who are on the ground in Ukraine drilling wells and monitoring the quality of water abstracted from them to better inform our model and groundtruth our work. As such, we would strongly advocate for consistent collection of environmental and geological information when creating new water abstraction points in Ukraine, though we of course acknowledge that this work is being undertaken in very challenging circumstances and that other considerations are likely to take priority. We also hope that this work encourages others with an interest in subsurface modelling, and knowledge of groundwater resources in Ukraine, to collaborate together with us to ensure that Ukraine’s groundwater environment is better understood and protected.
This project was led by CEOBS Junior Researchers Rob Watson and Jay Lindle. We extend special thanks to Prof. Boris Faybishenko for his assistance and feedback on our work, and also to Dr Kateryna Boiko for her helpful review and comments. With thanks to Erik Duncan at the University of Maryland for sharing locations of craters in Donetsk.
Method in brief
Our modelling assumes downward migration of pollutants from the land surface through the soil and upper rock layers until reaching the aquifer. The model does not account for the properties of potential pollutants, which in a militarised setting are highly variable in nature.3 The geological properties of the land and the amount of surface water infiltration are the only model inputs. Crucially, we only model the vulnerability of the uppermost aquifer, which may not be the primary source of drinking water for a given area: deeper aquifers that are cut off from the surface by impermeable layers are common sources of drinking water in Ukraine.
We employed a range of open-source datasets to represent these model inputs, including the International Hydrogeological Map of Europe, the European Soil Database, rainfall data collected across Ukraine from 1946-2020 by the Ukrainian Hydrometeorological Institute, and Soviet-era engineering geological maps and cave databases curated by independent Ukrainian civilian scientists.
Alongside the aforementioned model inputs that are used in all DRASTIC models, we have also approximated the influence of changes in the hydrological properties of the subsurface that are not captured by the geological data alone. We assume that these Preferential Flow Migration Zones can be represented by the presence of enclosed topographic depressions, which we delineated automatically from a digital elevation model using established algorithms.
A full description of our method and data is available in this Annex.
- Data of higher quality, such as 1:200k maps produced by the Ukrainian Geological Survey, are unavailable at this time due to the imposition of martial law across Ukraine heavily restricting their dissemination.
- See Barbulescu, 2020 for a comparative analysis of different DRASTIC methodological approaches incorporating various additional parameters.
- Contamination of groundwater in military settings may be caused by a wide range of pollutants, and these contaminants may partition between multiple media – water, air, soil and biosphere. Petroleum products are regularly released into soils and surface waters when military vehicles and aircraft are destroyed, together with a range of combustion products. Focusing solely on munitions themselves, heavy metals are released by the detonation of landmines and munition residues, and remain present for significant periods: there still remain high concentrations of copper, iron, lead and zinc in the soils of WWI battlefields, even in areas not shelled as intensively. There are also high concentrations of arsenic. From more modern battlefields an additional heavy metal contaminant can be depleted uranium (DU), which is radioactive and chemically toxic. Pollutants released by energetic compounds in military settings include explosives such as TNT (2,4,6-trinitrotoluene). TNT is used as a booster for high-explosive munitions and is highly chemically stable. This means it can remain in the soil even as UXO casings degrade, having long-term vegetation and human health impacts – high concentrations are still found at WWI battle sites for example. Groundwater contamination by TNT is more significant in sandy soils, whereas in high carbon soils TNT rapidly degrades and so is largely contained to the site of contamination. However, this chemical and microbiological decomposition can produce harmful derivatives, in particular DNT (2,4-dinitrotoluene). DNT is highly toxic, more so than TNT itself, and is listed by the US EPA as a priority pollutant in aquatic environments. RDX, Royal Demolition Explosive (hexahydro-1,3,5-trinitro-1,3,5-triazine) is another chemically and thermally stable compound. It is both less soluble and susceptible to degradation than TNT, and this makes it more likely to migrate through soils and contaminate groundwater. Energetic materials also contain propellants that include: nitroglycerin, which is relatively safe; nitrocellulose, is highly soluble and can quickly migrate into groundwater though is less toxic than RDX and TNT; nitroguanidine, is similar to nitrocellulose but can lead to eutrophication where degraded by sunlight; and ammonium perchlorate, which causes the most significant and long-term groundwater contamination. Transport and transformation of these chemicals are governed by: 1) the inherent properties of the compounds, like solubility and vapour pressure; 2) the nearby presence of energetics-degrading microorganisms; and 3) the local environment, especially soil type, weather and hydrogeology.


