Report: The war in Tigray is undermining its environmental recovery
Published: April, 2022 · Categories: Publications
Overview
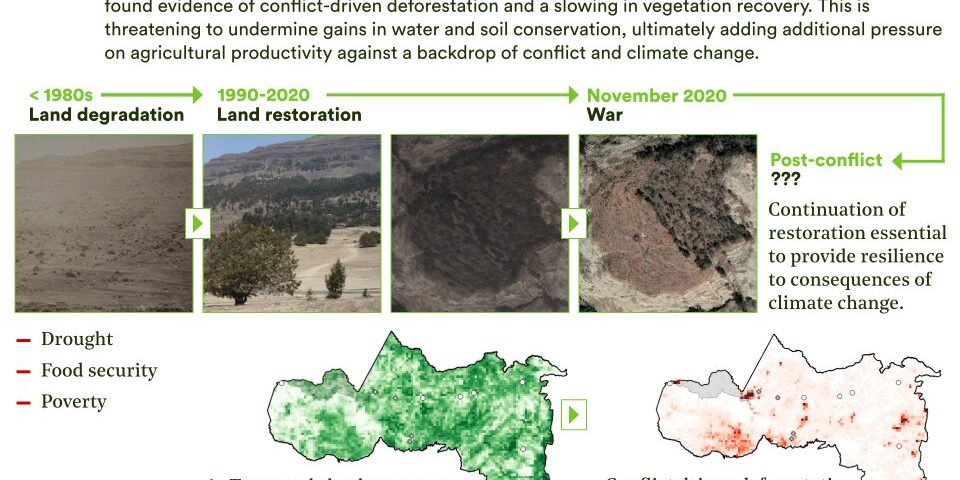
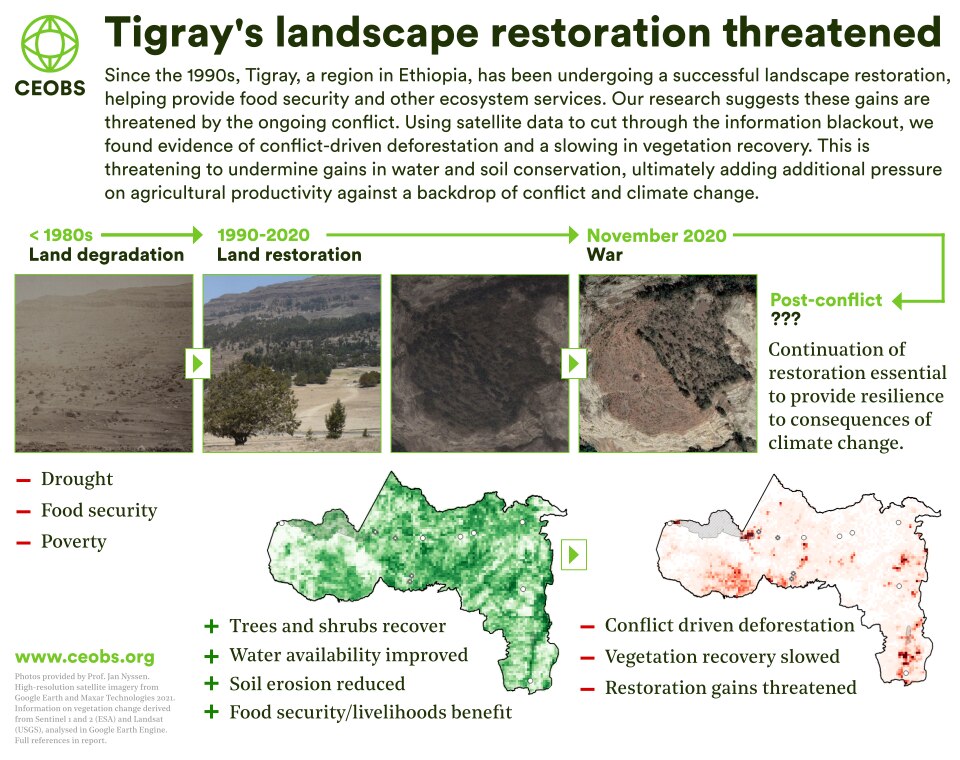
Our satellite analysis has identified hotspots of conflict-driven vegetation loss in Tigray in 2021 along the border with Amhara, around Kafta-Sheraro National Park in the north, and in the southern highlands. Rainfall, temperatures, locust invasions and fire cannot fully explain the patterns of observed woody vegetation loss, meaning conflict-driven deforestation is the most likely cause.
Wars can disrupt the supply of food, fuel, and other essential resources, forcing affected communities, as well as military forces, to increase their use of local ecosystems – we hypothesise this is what has happened in Tigray. The region has been under a de-facto blockade since November 2020, leading to a collapse in fuel and electricity supply that has likely, and anecdotally, led to an increased use of wood as a fuel source.
Over the last three decades, Tigray has seen a widespread recovery of woody vegetation as part of a suite of nature-based solutions to address food insecurity and poverty in the region. These successes are now under threat from conflict-driven deforestation. At the same time, previous recovery of woody vegetation may also have provided a buffer against the environmental impacts of the war.
The recovery of people and the environment from the war in Tigray need to be considered together: trees and other natural vegetation have been key to conserving water and soil in the past, reducing the impacts of the ongoing conflict, and they remain a major pillar of food security and climate resilience in the long-term.
In this report, Henrike Schulte to Bühne presents results from a large-scale analysis of high-resolution open-source satellite data showing vegetation change in Tigray.
Key findings
- We identified hotspots of woody vegetation loss across Tigray. These declines are most likely linked to conflict-driven collapse in the availability of fuel for heating and cooking.
- The long-term recovery of vegetation across Tigray appears to have slowed down, although it has not yet reversed.
- The restoration success of the last three decades has likely provided a buffer against the impacts of woody vegetation loss. However, ongoing deforestation is potentially eroding the efficacy of nature-based solutions in supporting food security across Tigray.
- After the end of the conflict, long-term recovery of human well-being and livelihoods will require restoring and protecting the environment in Tigray.
A reanalysis of this data showed that the loss of woody vegetation during the war was higher than reported here, affecting 4.0% of wooded areas (rather than 1.2%); the area undergoing vegetation recovery was also higher than reported (11.1% rather than 5.9%). This change does not affect the overall conclusions of this report. For updated statistics and Figures please refer to this publication: Schulte to Bühne, H., E. Darbyshire, T. G. Weldemichel, J. Nyssen, and D. Weir. 2024. Conflict-related environmental degradation threatens the success of landscape recovery in some areas in Tigray (Ethiopia). Ecology and Society 29(3):20. https://doi.org/10.5751/ES-
Watch the launch webinar for the report
Contents
1. Introduction
1.1 The war between Tigray and Ethiopia: A complex conflict and humanitarian crisis
Since November 2020, Ethiopia has been engaged in a devastating civil war with Tigray, one of its northern states. The conflict has resulted in a humanitarian crisis in Tigray as well as in neighbouring states such as Amhara and Afar since the conflict expanded from Tigray in the summer of 2021. In Tigray alone, there are around 1.8 million internally displaced people (IDPs), 350,000 people living in famine-like conditions, with 83% of people estimated to be affected by food insecurity.

Figure 1: Ethiopia is a landlocked, federal republic made up of 13 states and independent cities, including the capital Addis Ababa. Ben.-Gum.: Benishangul-Gumuz Region. SNNP: Southern Nations, Nationalities and Peoples Region.
This humanitarian crisis has been exacerbated by the de-facto blockade of Tigray. Very little overland transport has arrived since the start of the war, reducing or eliminating the supply of essential food items and fuel, as well as the delivery of humanitarian aid. In addition, there has been an electricity blackout (Figure 2), and telecommunication and banking services have been blocked, further intensifying the humanitarian crisis and making it difficult to gather information about conditions on the ground. This not only puts roadblocks in front of humanitarian responses, but also increases the risk of the conflict in Tigray becoming a ‘forgotten crisis’, with too little attention from international stakeholders whose influence could otherwise assist in addressing the conflict.

Figure 2: Since the start of the electricity blackout in February 2021, a decline in nighttime lights has been visible from space, particularly in larger cities. The bright spots could indicate fires that burn during the night; however, brighter areas do not systematically overlap with hotspots of fire activity and burned areas detected by other satellites (see Figure 8).
1.2 How the environment, conflict and food security are connected in Tigray
In Tigray, as throughout Ethiopia, people’s livelihoods, food security, and overall well-being are closely tied to their local environment. Agriculture is the most important sector in Ethiopia, generating about a third of its GDP and employing about two thirds of its population. Subsistence agriculture is a major source of food for rural communities in particular, but food security is limited owing to agricultural output being highly dependent on the timing and amount of rainfall in the rainy seasons.
Tigray has a subtropical climate and is among the driest regions of Ethiopia, receiving an average of 590 mm rainfall annually. While some precipitation occurs from February to May in the belg season, most rain falls during the kremti season (June-September), which is followed by the bega dry season (October-January). Across the region, differences in elevation lead to a strong spatial difference in climate: Whereas the south and east have higher elevations, more rainfall and lower temperatures (down to an average of 7.5 °C at >3,500 m elevation), the north and west are more arid, with lower rainfall and higher temperatures up to 27 °C. Locally, climate can vary at small spatial scales depending on elevation. There is also significant interannual variability in rainfall, which affects agricultural output, and thus livelihoods. For instance, the infamous famine in the 1980s was triggered by drought. In addition, Tigray in particular historically suffered from widespread soil erosion due to large-scale clearing of vegetation, which led to losses in soil and soil fertility and, consequently, agricultural productivity.
To address persistent poverty and food insecurity, such as that illustrated by the 1980s famine, the Tigray regional government has long pursued nature-based solutions. In the 1990s, it developed a so-called conservation-based agricultural development policy, which emphasised the recovery and conservation of natural resources as a strategy to improve agricultural output and food sovereignty. In the early 2000s, there was a shift from input-focused policies, such as encouraging fertiliser use by farmers, which had shown limited success, towards large-scale landscape restoration and reshaping. The idea behind this was to create a landscape that is better at retaining and accumulating both water and soil, two key resources for agricultural production, rather than solely focusing on chemical, labour or financial inputs to agricultural production, which are more traditionally chosen by policy makers when tackling low agricultural outputs.
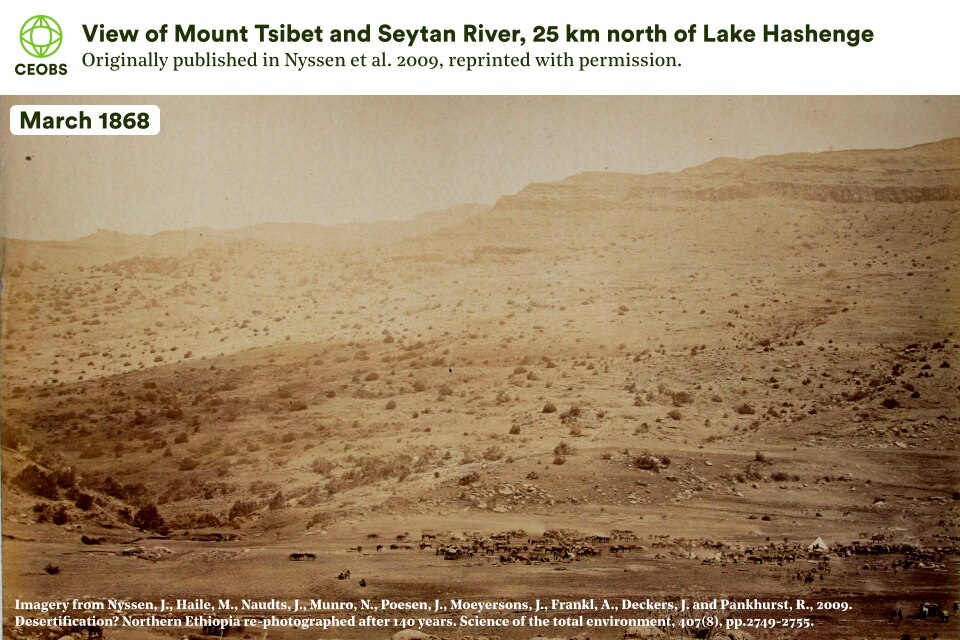
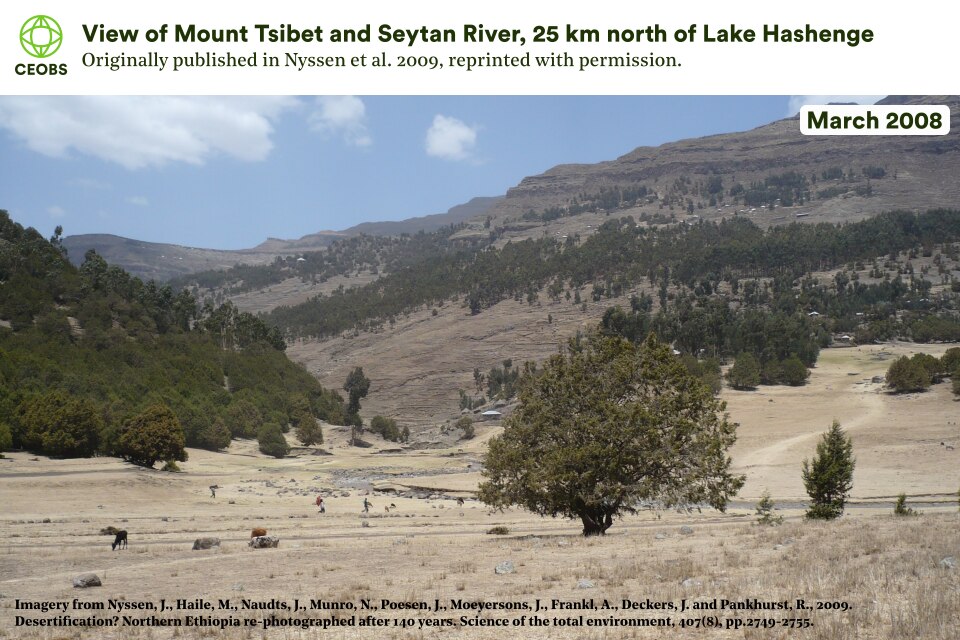
Figure 3: Historical landscape photography reveals the change in vegetation that has taken place across Tigray. The historical picture was taken as part of a military expedition by British armed forces in 1868; the second picture was taken 140 years later. Pictures originally published here and reproduced with permission from the first author.
While this landscape reshaping included physical infrastructure such as stone bunds, dams and ponds, a keystone of the strategy was the establishment of exclosures to allow natural vegetation to recover. Exclosures are areas affected by land degradation in which domestic animals are no longer allowed to graze, and no wood cutting is allowed, removing grazing pressure and allowing vegetation to regenerate. These exclosures, which in 2013 covered ca. 1.2 million ha1 – almost 25% of Tigray’s surface area – were successful at increasing vegetation cover, including trees and other woody vegetation (Figure 3), reducing soil loss, improving soil fertility and structure, and improving the recharge of shallow groundwater.
It has been estimated that soil and water conservation interventions have reduced erosion rates by 68% (comparing 1975 to 2006), and case studies report increases in crop productivity between 12-50%. Collectively, conservation measures, realised predominantly through labour provided by local communities, sometimes in return for payment or food and often entirely without individual compensation, improved food security across the region, leading to Tigray being widely hailed as a global leader in landscape restoration
However, this success is now under threat. The power blackout and blockade means that wood is very likely the main or only source of fuel (e.g. for cooking) and construction material available to many people in Tigray, and it is possible that levels of deforestation have increased. This could significantly reduce tree and shrub cover, with negative impacts on soil and water conservation, as well as biodiversity. To gauge the magnitude of this potential threat, we investigated whether there has been widespread loss of trees and shrubs across Tigray since the war.
The scope of our analysis is limited to documenting changes in woody vegetation and identifying plausible conflict-linked drivers. This study does not include identifying actors who may be responsible, as to do so requires on-the-ground evidence.
2. Measuring the loss of woody vegetation from space
The blockade and information blackout currently make it very difficult to gather information on the ground in Tigray. Instead, we used a combination of existing groundtruth data gathered before the start of the war by Prof. Jan Nyssen and colleagues at the University of Ghent, Belgium, and publicly available satellite data to investigate whether tree and shrub cover has declined across Tigray since the start of the war. Although this type of remote approach has some uncertainty, it is the best way to understand the region-wide vegetation dynamics given the regional communication blackouts, dangers of on-the-ground observations, and prevalence of disinformation online. A detailed description of our methodology is available in the Appendix. In brief, the analysis included:
1. Using relatively high-resolution (10 m) satellite imagery from ESA’s Sentinel 1 and 2 satellites to map areas where trees or other woody vegetation were present in 2020 before the war (Figure 4). Besides closed canopy forests, which can still be found in Tigray (for instance in church forests), we were also interested in mapping areas with scattered trees and shrubs, which can for instance be found in young to mid-aged exclosures. We were able to map trees and other woody vegetation with a high overall accuracy of 97%.
2. Using USGS’s Landsat 5, 7 and 8 satellite data to extract timeseries of a vegetation index commonly used as a proxy for vegetation health, vigour and cover (the Normalized Difference Vegetation Index, or NDVI). We identified all pixels that showed a statistically significant change in NDVI that occurred at any time between 1 January 2021 and 15 December 2021 (the date of the most recent Landsat 8 data available at the time of analysis), which we assume to be a reasonable time when impacts from the power blackout and blockade may have already manifested.
3. Combining the maps from (1) and (2) to identify pixels that both contained trees or other woody vegetation before the war, and had evidence of declines in vegetation health, vigour and cover after the war had started. These represent areas where trees and shrubs are most likely to have been removed. We also identified pixels which showed evidence of increases in vegetation health, vigour and cover, for comparison.
4. We then repeated (1)-(3) for three other years, to gauge whether the patterns of NDVI changes seen in 2021 were different from those normally observed. We chose an exceptionally dry year (2015) and a comparatively wet year (2019) to show the potential impact of interannual climate variability on NDVI changes, as well as the year immediately before the war (2020), to compare post-war to pre-war changes in trees and other woody vegetation.

Figure 4: Tree and shrub cover – both in closed canopy forests, and as scattered formations – was mapped using Sentinel 1 and 2 satellite data (10 m resolution). For easier visualisation, we here display the percentage of Sentinel pixels that contained trees or shrubs before the war in each 3 km by 3 km pixel. Note that this map does not show tree or woody vegetation cover itself, as areas with varying densities of woody vegetation (from closed-canopy forest to scattered shrubs) were included in our definition of wooded vegetation.
3. Results
3.1 Loss of woody vegetation in 2021
Our results show that there is evidence for trees and other woody vegetation being lost in localised hotspots across Tigray, notably in the north around the eastern and western borders of Kafta-Sheraro National Park (located east of Himora), south of the Hugumburda-Girakahsu National Forest Priority Area (located between Alamata and Mekelle), between Mekelle and Adigrat, as well as a more diffuse area of NDVI declines roughly along its southern border with Amhara (Figure 5; note that this Figure shows the most conservative estimate of NDVI declines across trees and other woody vegetation, see Appendix, Figures S1-S5).
Our analysis cannot provide information about the extent to which trees have been lost, i.e. whether some areas have been clear-felled, or whether deforestation has been more diffuse. However, it is clear that there are localised, but significant, pressures on woody vegetation across Tigray.

Figure 5: – Distribution of potential loss of trees and other woody vegetation in Tigray. To make visualisation easier, the maps are here presented at a 3 km resolution (the original resolution is 30 m). Each 3 km pixel contains the percentage of smaller pixels (30 m) that have undergone a significant NDVI decline with high certainty since February 2021 (see Appendix for explanation of how likelihood of change was determined, and the choice of time period).
3.2 Significance of 2021’s woody vegetation decline
These declines are more widespread than those observed in 2019 and 2020, although the drought year 2015 had even more widespread declines in vegetation condition (see Figures S1-5). The declines also occur in different places than in earlier years, suggesting that the response of vegetation in 2021 is not merely a continuation of ongoing trends.
Notably, evidence for declines in woody vegetation is visible around Tigray’s two Protected Areas. Two hotspots of NDVI declines are located at the eastern and western-most borders of Kafta-Sheraro National Park. This suggests that formal protection status was not entirely successful at limiting environmental degradation during 2021. Unfortunately, and to our knowledge, there is no map of exclosures across Tigray, so we were not able to assess their ability to protect vegetation cover during the war.
Once the security situation has improved, and to inform recovery strategies, it will be important to carry out on-the-ground verification of our results, and wider investigations into the environmental impacts of the war. However, woody vegetation seems to be faring well elsewhere in Tigray, particularly in the north east (see Section 3.4), a positive sign that woody vegetation in Tigray has withstood threats from insecurity and war in many cases.
3.3 Drivers of loss of woody vegetation cover or productivity in 2021
Satellite imagery reveals that the informal waste dump that the area was developed around has come back into use during the conflict. Fresh deposition is visible from March 2016 onwards, with activity increasing over time. Meanwhile water channels on the site’s western edge have also been infilled with what appears to be building rubble, potentially affecting the hydrology of the wetland. This fits a country-wide pattern in the informal disposal of solid waste. Light industrial units have encroached on the site and on its water source from the treatment plant.
Climate
Overall, precipitation and temperatures in Tigray were normal (Figure 6A), despite other areas in Ethiopia experiencing drought in the same year. There were areas that received less rainfall (Figure 6B) and/or were hotter than normal (Figure 6C). However, these do not systematically overlap with the areas that have potentially lost tree cover. In fact, areas in the south that received higher than normal rainfall also experienced widespread NDVI decline. This means that the observed changes in vegetation are unlikely to be the result of less rainfall and/or temperatures.
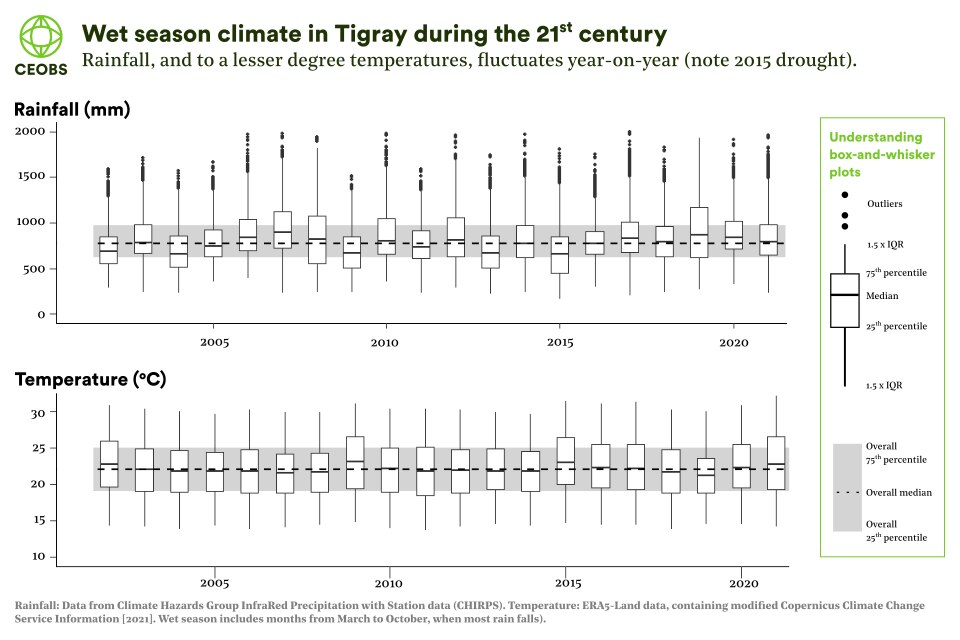
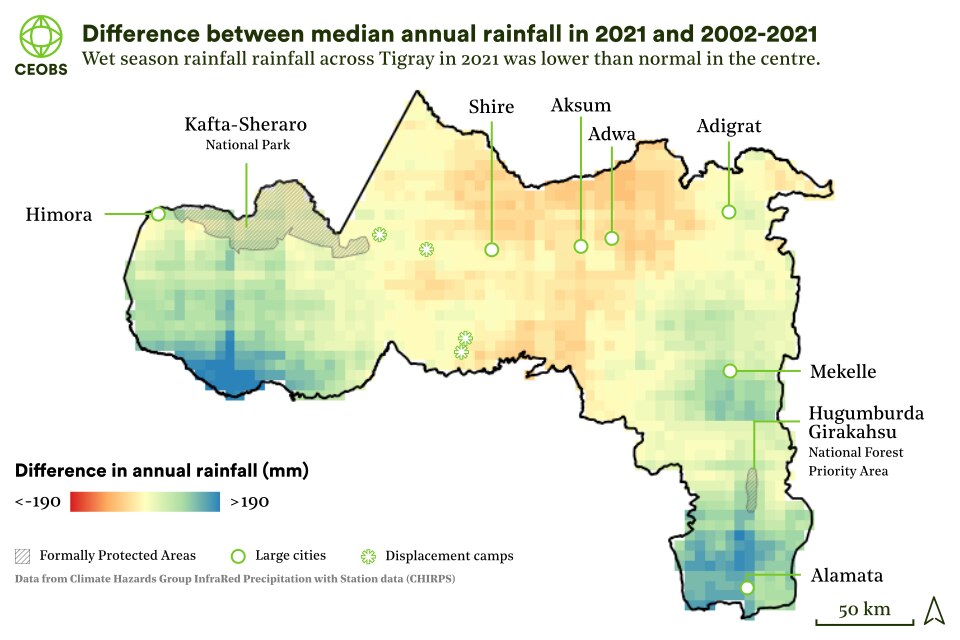
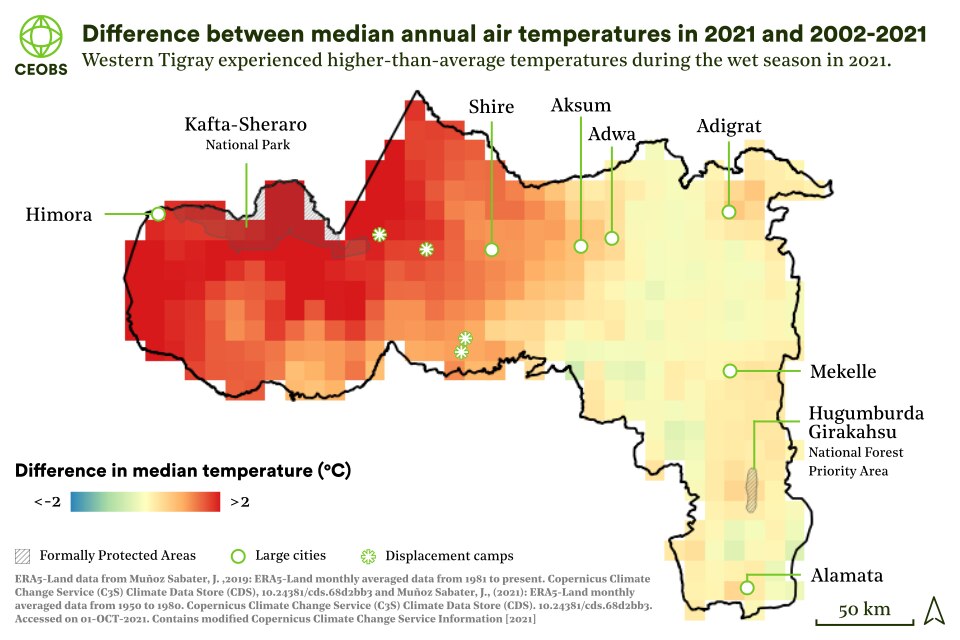
Figure 6. A: Climate records for Tigray since 2002. IQR: Interquartile range (the difference between the 25th and 75th percentile). B: Difference between rainfall received during the wet seasons (March – October) in 2021 and median rainfall received during the 21st century. C: Comparison of temperatures during 2021 wet seasons and median temperatures during the 21st century.
Locusts
The Horn of Africa has been experiencing a locust infestation since early 2020, which could conceivably be driving declines in vegetation in Ethiopia. However, in Tigray, locusts were reported only along the southern highlands in 2020 – essentially along a northeast-to-southeast axis (see Figure S7). While monitoring in 2021 was impossible due to the security situation, the movement of locusts around the wider region indicates that Tigray was mainly spared in 2021 (Figure 7). While it cannot be ruled out that the potential loss of trees and other woody vegetation in Tigray, especially in the east, was entirely unaffected by the locusts, the presence of healthy trees in the same areas suggests they cannot be the only driver.

Figure 7: Locust monitoring has not been carried out in Tigray since the start of the war. However, places where locusts have been observed close to the border (e.g. Eritrea) are not close to those areas experiencing widespread vegetation decline.
Fire
It is also unlikely that fires are behind the patterns of NDVI decline in areas with trees or other woody vegetation, as satellite data indicates that there have not been more fires than usual since the start of the war (see Figure 8, and Figure S6 in Supplementary Materials). “Fire season” in Tigray starts around October at the beginning of the bega dry season and ends in May or June (at the start of the main rainy season), with a peak in March. From the start of the war in November 2020 until the end of the fire season in May 2021, a total of 3,792 fires were detected, which is the lowest count in the same time period since 2016. Fire activity in the most recent fire season, which started around October 2021, and is at the time of writing still ongoing, seems to be somewhat higher however.
It should be noted that the spatial resolution of spaceborne sensors that monitor fires tends to be coarse – normally 100s of meters – so it is likely that smaller fires, including those that may occur when individual houses or small settlements burn down, have been missed. However, given that we focus on the potential impact of fires on vegetation, which likely scale with fire extent, using these relatively coarse data is appropriate for our purposes.
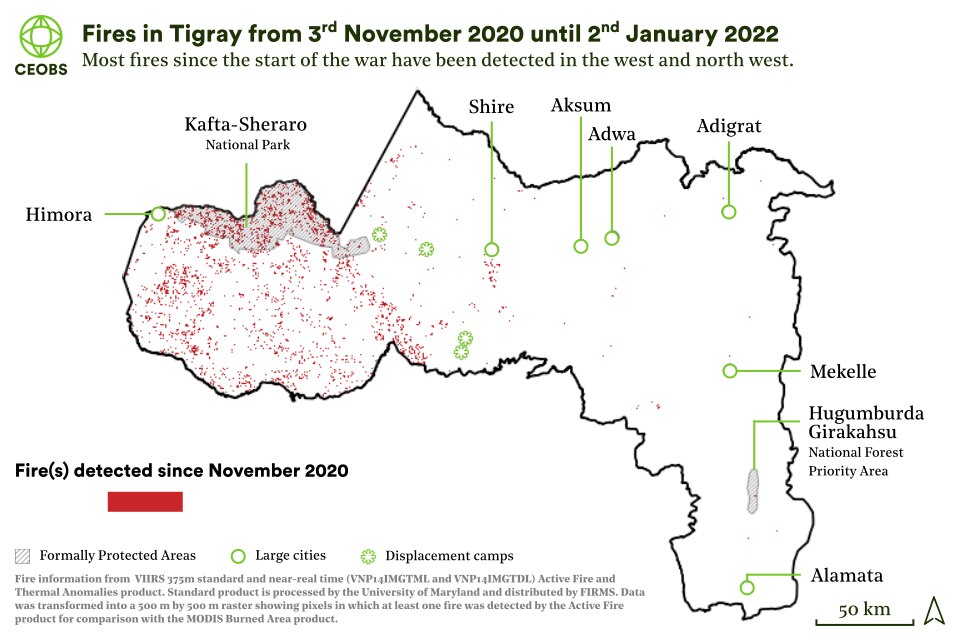
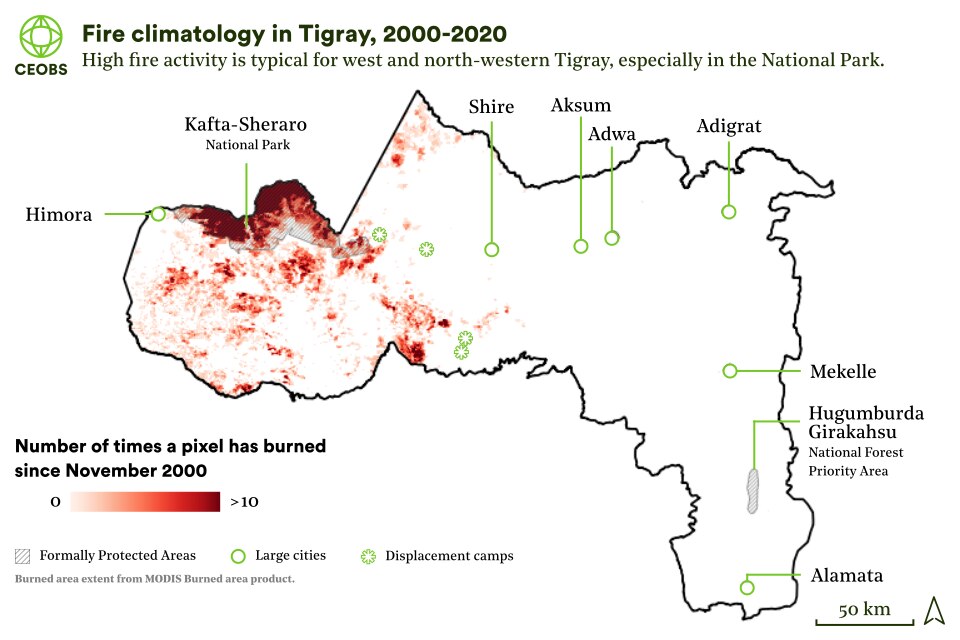
Figure 8: A-Fire incidence across Tigray since the start of the war in November 2020. The conflict has so far affected two fire seasons, one starting at the beginning of the dry season in 2020, and the current (at time of writing) fire season, which started at the beginning of the 2021 dry season. The spatial resolution of the underlying data is 375 m, and thus it may miss smaller fires. As such, this data cannot rule out that there have been no fires in the centre and south of Tigray. B-The distribution of fires in 2021 matches long-term fire activity across Tigray, as detected by the MODIS Burned Area product (MCD64A1; 500 m spatial resolution; ca. daily temporal resolution).
The spatial distribution of fires (Figure 8A) shows that areas of intensive fire activity since the start of the war do not systematically overlap with areas of NDVI decline (or NDVI increase), again suggesting that fires have not been a major driver of woody vegetation dynamics in Tigray since the start of the war. Notably, fire activity is very high in Kafta-Sheraro National Park in the north, a pattern that is also visible in longer-term fire records (Figure 8B). This suggests that this may be “natural” fire disturbance, as is common in savannah ecosystems, where fires typically burn the grass layer and tree species are fire tolerant. Indeed, vegetation in western Tigray, including the National Park, is dominated by combretum woodland, a vegetation type that burns very frequently.
Conflict
Because the most likely other candidate drivers do not seem to be significant contributors to the observed loss of woody vegetation, this leads us to conclude the loss is likely connected to the conflict. This could be driven directly by the presence of military forces in Tigray, either through scorched earth tactics, or as a result of military personnel using locally sourced wood to supplement their fuel reserves, as was reportedly observed during the Ethiopian-Eritrean war in the 20th Century.
In addition, civilians across Tigray may have increased their use of firewood due to the fuel and electricity crises driven by the blockade. Locally-sourced wood was already a common fuel, especially in rural areas, before the start of the conflict. Three eyewitness reports, which CEOBS has seen but was unable to independently verify, suggest that trees have been cut down as a result of the power blackout in Tigray. One anonymous source reported that “[o]f course there is high deforestation for firewood sold to the town as there is no electricity, and also for charcoaling”, while another said that “[u]nfortunately, in some place the indigenous shrubs have been intensively cutting [sic] for firewood and preparation of charcoal”. A third source suggested that this is due to the energy crisis, highlighting that “[b]esides being cut off from electricity, Tigray is also cut off from external sources of charcoal”. Fuel shortages have also been reported by humanitarian organisations in the context of barriers to supplying humanitarian aid.
High-resolution imagery from Google Earth (Figure 9) indeed shows evidence for charcoaling, a process that creates a lighter, more efficient fuel from wood. According to Dr. Teklehaymanot Weldemichel, a postdoctoral fellow at the Norwegian University of Science and Technology, who is from Tigray, “[p]ressed by the livelihood needs and attracted by the growing demand for fuel wood in towns, farmers in Tigray have likely shifted [to] charcoal and fuel wood trade”.
In areas where buildings have been destroyed, and where the security situation allows rebuilding already, people may also be turning to local tree stands for construction material. Dr. Weldemichel suggests that “in the absence of any formal market, they are likely sourcing the timber needed to rebuild their homes from locally available patches of forest.”
Anecdotally, plantations of non-native Eucalyptus (as in Figure 9) have been an important source of wood during the war, suggesting that deforestation rates in native woody vegetation may be less severe than overall rates. However, in the absence of any detailed information from the ground, this hypothesis remains to be proven. There may also be mechanisms by which the effects of the conflict indirectly benefit woody vegetation cover, for example through the displacement of people and livestock, or where food shortages reduce demand for fuel.
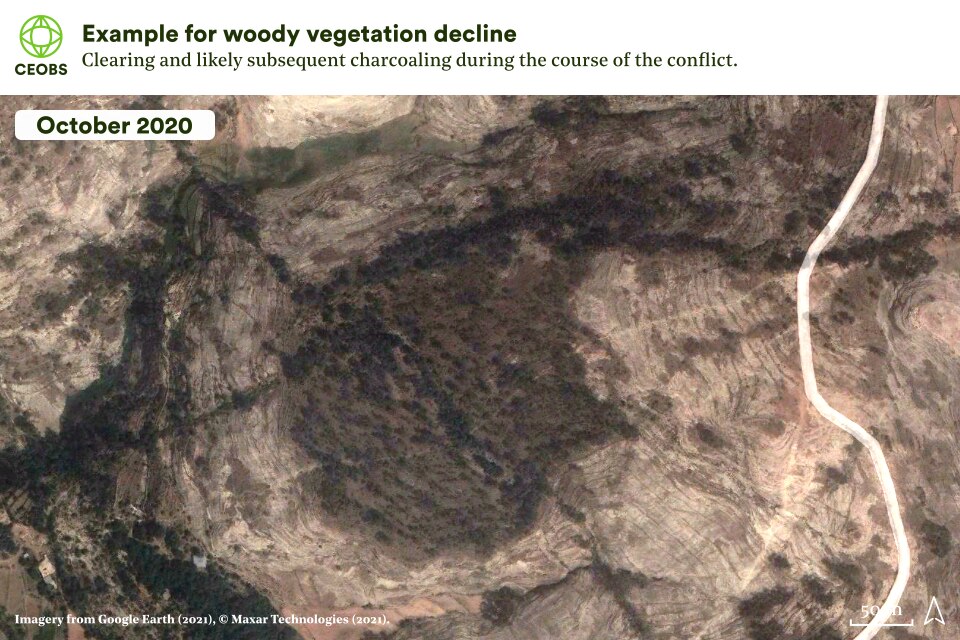
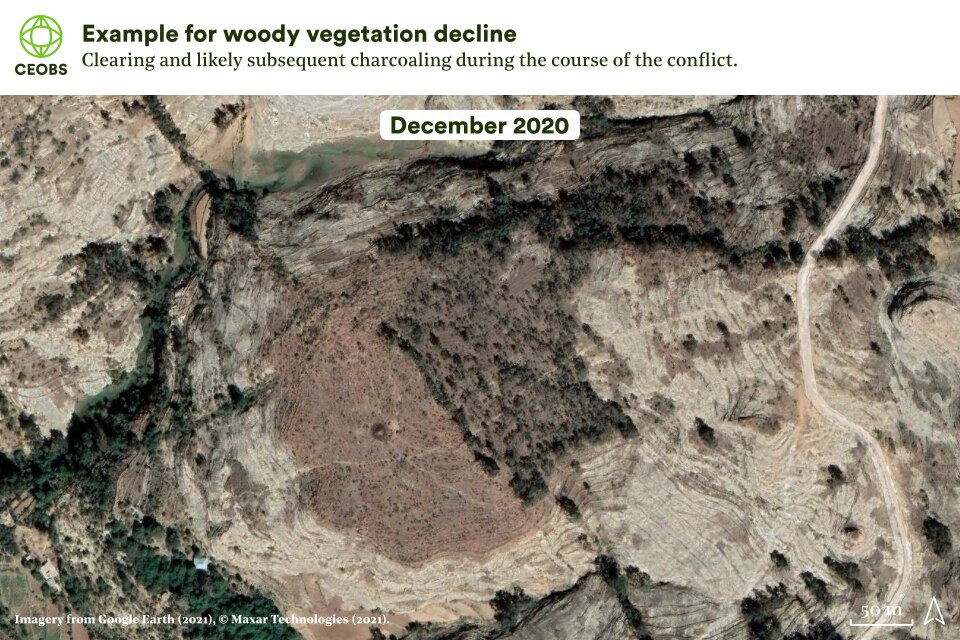
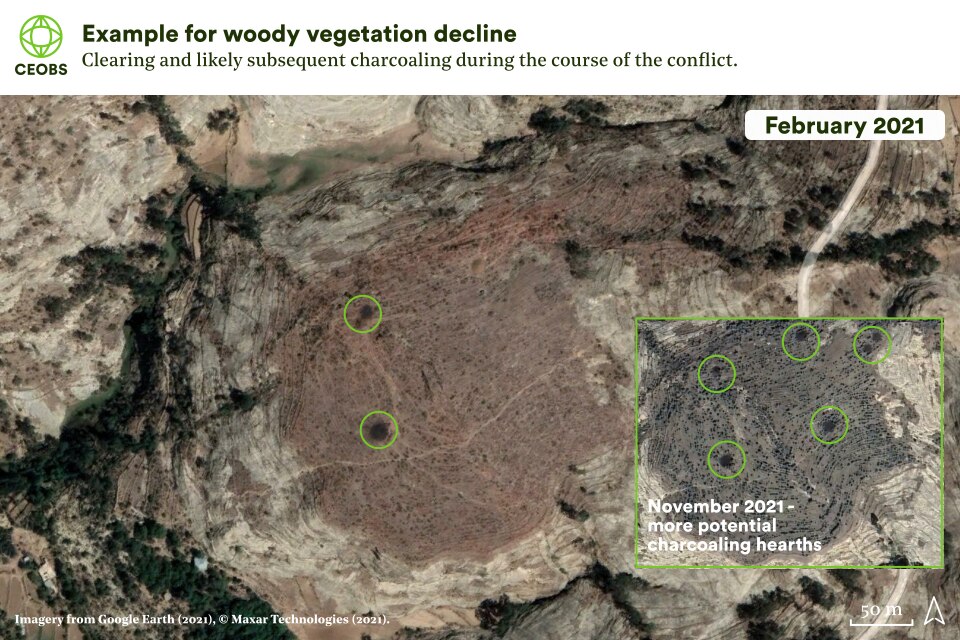
Figure 9. Google Earth imagery before and after the start of the war in November 2020. In many cases, Google Earth imagery is not yet available across Tigray for 2021. We chose before images as close as possible to the start of the war, to minimise the chance of attributing earlier losses of vegetation to the conflict. Image location available upon request from CEOBS here.
There is no indication that patterns of negative impacts on trees and other woody vegetation seem to be directly concentrated around known camps for Eritrean refugees, or cities that have been hosting large numbers of IDPs, mainly from the west and north west of the region (Figures 5). Since it is likely that anyone currently in Tigray – including IDPs and refugees – will have demand for wood, the location of conflict-driven hotspots of vegetation decline may instead be driven by a combination of tree availability, accessibility, and connection to large population centres. Interestingly, there seems to be a region of vegetation decline in southern Tigray following, roughly, areas with lots of woody vegetation cover along the main highways, with a hotspot around Lake Hashenge, as well as the highway that connects the Amhara border to Shire. While it is not possible to investigate the proximate drivers of vegetation declines, it is possible that these areas are especially vulnerable to deforestation as they are rich in wood, relatively easy to access, and allow for transportation of harvested wood.
3.4 Gains in woody vegetation cover or productivity
Large areas of woody vegetation across Tigray have gained cover or productivity during the study period, especially in the north east, although gains in cover and productivity were subdued compared to other non-drought years (Figure 10, c.f. Figure S1-5). This means that, if the war had not occurred, vegetation recovery may likely have been stronger or would have occurred over a greater extent. Confirming this hypothesis requires predicting expected NDVI dynamics in 2021 and is outside of the scope of the work presented here. However, the presence of NDVI increases suggests that, despite the increasing demand for locally sources firewood and/or timber for construction, losing woody vegetation is not inevitable.

Figure 10: Areas in Tigray that have very likely undergone significant regrowth and/or vegetation expansion in 2021. To make visualisation easier, the maps are here presented at a 3 km resolution (the original resolution is 30 m). Each 3 km pixel contains the percentage of smaller pixels (30 m) that have undergone a significant NDVI increase with high certainty since February 2021 (see Appendix for explanation of how likelihood of change was determined, and the choice of time period).
Vegetation cover, including woody vegetation, has been recovering across Tigray since the beginning of the 21th Century, and it is reasonable to assume that further gains in woody vegetation NDVI would have been expected under pre-war climate and management conditions. Notably, hotspots of vegetation recovery in 2021, for example in the north east, but also in a smaller area in the west, do not overlap with hotspots of recovery in 2019 and 2020 (Figures S3-5). This would be expected if, after a year of strong recovery, vegetation in a given place would have limited opportunity to recover further in the next year due to increasing competition over space or water.
There are several potential drivers that could be responsible – alone or working together – for driving local increases in woody vegetation cover or productivity, such as simultaneous maturation of large, even-aged stands, like those created by afforestation projects, or from a previous stand-replacing disturbance such as a very strong fire, disease outbreak, or human resource use. However, these explanations remain to be confirmed by on-the-ground observations.
4. Implications of conflict-driven environmental degradation in Tigray for long-term recovery
In areas where trees and shrubs have been lost, their soil- and water conserving properties will be reduced. This may lead to reductions in agricultural output – as was observed before the widespread adoption of exclosures – exacerbating current food shortages and famine-like conditions for people living in Tigray. In the long-term, environmental degradation will hamper the recovery of local communities from the war and reduce the resilience of food security and livelihoods to climate change. The magnitude of these consequences of environmental degradation cannot be quantified in absolute terms based on remotely sensed data alone. This will only be possible once security has been restored in Tigray and on-the-ground investigation becomes possible. However, our analysis suggests that there are likely to be hotspots of vegetation degradation that warrant particular attention.
Tigray illustrates that nature-based solutions to societal problems can be just as vulnerable to armed conflicts as other environmental strategies and policies. When undisturbed, nature-based solutions are often robust, sustainable, and successful in fulfilling people’s needs, as was the case in Tigray before the war, and as has been demonstrated elsewhere. Importantly, the impacts of conflict-driven deforestation would very likely have been much more significant without the widespread recovery of woody vegetation in the decades prior: Any woody vegetation losses occurred from a higher baseline of woody vegetation cover thanks to widespread landscape restoration. This illustrates how nature-based solutions can boost the resistance or resilience of the environment to external shocks, such as armed conflicts.
However, wars change people’s resource needs and the way they are supplied. In these situations, there is a risk that the natural resources that underpin nature-based solutions will be degraded as part of coping and survival strategies. Where this happens, the restoration and recovery of the environmental scaffold nature-based solutions provide ought to be considered an essential process during wider societal recovery from conflict – much like restoring roads and other important infrastructure.
Loss of trees and other woody vegetation erodes climate resilience and thus would increase Tigray’s already high vulnerability to climate change. Scientists are predicting a drought over East Africa for 2021 and 2022, which would put further pressure on agriculture and food supplies. Droughts are in fact expected to become more frequent due to climate change and, although projections are uncertain, climate change is very likely to reduce yields of key crops in Tigray in the future. This highlights the importance of nature-based solutions to safeguard livelihoods and people’s wellbeing in the future.
The environmental impact of the Ethiopian civil war, and its knock-on effects on poverty, food security and long-term resilience to climate change, likely extends beyond Tigray. We focused on this region in our analysis because the conflict started here and thus, by the time of the analysis, there was a higher chance of environmental impacts from the war having already manifested and being reflected in the available data. In addition, the effects of the blockade are more intensive here than in other regions of Ethiopia. Neighbouring states, especially Amhara and Afar, may also have experienced environmental degradation, for example through the clearing of vegetation, or through other drivers.
To restore and safeguard food security, livelihoods and the well-being of people living in Tigray and beyond in the long term, it is important that:
1) There is an end to the conflict, blackout and blockade, in order to allow humanitarian aid to reach those in need, but also to restore markets for agricultural inputs and outputs, fuel, and other resources, which will decrease pressure on natural resources.
2) The financial, social and logistical infrastructure that supports landscape restoration across Tigray is rebuilt, and physical soil- and water conservation structures, irrigation infrastructure, tree nurseries, and exclosures destroyed during the war are restored.
3) Plans for the recovery of Tigray build on the success of proven nature-based solutions. Such plans need to ensure that natural resources are protected and enhanced in order to improve food security and livelihoods and support the long-term climatic resilience of agricultural production. For instance, sourcing materials for the rebuilding of destroyed infrastructure and buildings should not further damage woody vegetation, or surviving soil and water conservation infrastructure.
5. Outlook
Until the war in Ethiopia ends, environmental degradation linked to the conflict will continue. We have shown here that the environmental consequences of the war are already visible in Tigray, where the war first started. This study shows the loss of woody vegetation, but there are likely further environmental impacts: on key infrastructure, agricultural productivity, livestock, wildlife, and the loss of local knowledge of landscape management. Further, neighbouring regions such as Amhara and Afar may not be far behind, given the conflict’s expansion from Tigray.
It is vital that on-the-ground investigations into the environmental impact of the war are carried out in all affected regions once it is safe and feasible to do so. Apart from changes in vegetation cover, especially in exclosures, it will be important to assess the status of soil and water infrastructure, including irrigation systems, as these are difficult to detect from space.
Finally, attention needs to be paid to the effects of the war on organisational structures that support mutually beneficial people-nature relationships, such as informal and formal community associations and agricultural extension services, as these will be key to a successful and sustainable recovery of communities across the region.
Henrike Schulte to Bühne is a conservation scientist and Honorary Research Associate at the Institute of Zoology, Zoological Society of London. She carried out this analysis while employed by CEOBS. We are grateful to Dr. Teklehaymanot Weldemichel, Norwegian University of Science and Technology, and Prof. Jan Nyssen, University of Ghent, for their contributions to the research and for reviewing the report. Doug Weir and Dr. Eoghan Darbyshire contributed to the conceptualisation and writing. High resolution versions of the figures in this report can be download here.
Appendix: Detailed methodology
A1. Mapping areas with trees and other woody vegetation before the war
A1.1 Satellite data
Pre-conflict land cover in Tigray was mapped using data from ESA’s Sentinel 1 and 2 satellite missions. Sentinel 1 provides radar data, while Sentinel 2 provides multispectral data; a combination of this data has been shown to improve land cover classification accuracies in landscapes with scattered trees, such as is found in many places in Tigray. In Google Earth Engine, Sentinel 1 and 2 data covering Tigray and acquired in September and October 2020 (i.e. just before the start of the war, and at the start of the dry season), as well as in January and February 2020 (at the end of the previous dry season) was selected. Having observations from multiple seasons helps differentiate between land cover classes, as their spectral and backscatter properties often change in characteristic ways over time.
Pre-processing was carried out in Google Earth Engine as follows: A radiometric slope correction was applied to the Sentinel 1 (radar) ground-range detected data to correct for distortions due to the hilly topography in Tigray. For pixels with multiple observations in September and October 2020, the median backscatter value for each band (VV and VH) was calculated, to create a single value per pixel; the same process was carried out for the January/February data. As multispectral sensors such as those onboard Sentinel 2 cannot see “through” clouds, the cloud probability mask provided with the Sentinel 2 surface reflectance product was used to mask out any pixels with a likelihood of >15% of being covered by a cloud. Finally, for pixels with multiple observations in January/February and September/October 2020 respectively, the median spectral value for each band (B1-8, B8A, B9, B11, B12) was calculated, again resulting in a single value per pixel per season.
The data was then downloaded from Google Earth Engine, and further analysis was carried out in R and QGIS.
A1.2 Groundtruth data
Given the large size of Tigray (ca. 50,000 km2), inability to access the region due to the security situation, and urgent need to monitor environmental degradation, groundtruth data were obtained by drawing polygons around homogenous patches of different land cover classes visible in very high resolution imagery available on Google Earth Pro (see Table S1). For areas where no imagery was available from January to October 2020 (i.e., before the start of the war), groundtruth data was only extracted if 1) there was clear imagery for one or several time point before 2020, 2) imagery acquired after the war had started was available and 2) land cover appeared unchanged. The remote sensing analyst (Henrike Schulte to Bühne, HS) used spatially referenced land cover data collected on the ground before the war by Professor Jan Nyssen and colleagues at the University of Ghent as examples for land cover classes. The groundtruth data collected by HS on Google Earth was checked by two researchers with extensive experience mapping land cover across Tigray (Jan Nyssen and Daan Temmerman) to ensure they were correct.
Then, a groundtruth observation (i.e., the value of each Sentinel 1 and 2 band) was extracted for each pixel that was fully covered by a groundtruth polygon. Groundtruth data for water, bare ground and built up were checked against RGB composites of the Sentinel 2 satellite data (see above) as these classes tend to have small patches.
Table S1: Land cover classes for classification. Points for training and validation of the classification algorithm were extracted from hand-drawn polygons.
| Land cover class | Description | No. of polygons | No. of points | Median number of points per polygon |
|---|---|---|---|---|
| Bare ground | No visible vegetation cover | 45 | 1853 | 29 |
| Dry grassland | Majority of the ground is covered in vegetation, but no woody vegetation is visible. Often bare during dry season. | 50 | 2856 | 57 |
| Wet grassland | Grassland which is flooded for at least part of the year. Retains greenness throughout the year. | 14 | 823 | 67 |
| Forest | An area with trees that stand so close together that their canopies entirely cover the ground | 54 | 4999 | 100 |
| Other woody vegetation | An area with scattered trees or shrubs whose canopy does not cover the ground entirely | 85 | 7903 | 100 |
| Rainfed cropland | Cropland which does not receive any water beyond rainfall. | 57 | 5127 | 100 |
| Irrigated cropland | Cropland which receives additional water; often looks darker than neighbouring rainfed fields, or situated along rivers/topographic depressions | 53 | 5199 | 100 |
| Built-up | Any human-made surface, including buildings and tarmacked roads | 46 | 3026 | 88 |
| Water | Surface water (lake, pond or river) | 43 | 3237 | 99 |
A1.3 Land cover mapping
A machine-learning approach was used to create a land cover map of Tigray. This approach involves: 1) Training a machine learning algorithm (here, the “random forest” algorithm implemented in the randomForest package in R, based on Breiman et al. 2001) to distinguish between different land cover classes in a training set based on their properties (here, the backscatter and spectral values from Sentinel 1 and 2 data). 2) Predicting which category each pixel belongs to, based on its properties. 3) Assessing the accuracy of the predictions using a validation set, which has not been used to train the algorithm and so (in theory) should provide a good estimate of the classification accuracy.
To create training and validation data sets, 60% of the groundtruth data was assigned to the training set, and the remainder to the validation set, ensuring that the points in these two sets came from different polygons. This minimises overfitting the classification model to the data. The proportion of each land cover class in the full set (see Table S1) was retained in both the training and validation set. A random forest model was created based on the training data alone, growing 1000 trees and using 5 variables to split at each tree node.
Because random forest is a stochastic algorithm (meaning that there is an element of randomness), and the classification model it produces depends on the data that is used to train, the choice of training and validation datasets can affect the classification outcome. To make the land cover mapping robust to the choice of training and validation data, 9 further training and validation sets were sampled, resulting in a total of 10 training/validation set combinations. The land cover classification repeated for each, meaning a total of 10 land cover maps were generated.
The overall accuracy of the 10 land cover maps ranged between 64% and 69%. A consensus map was created from these 10 maps by majority vote: for each pixel, each land cover map represented a vote on which land cover class it belonged to. Only pixels where a simple majority of land cover classifications agreed on a classification were retained and assigned that land cover class. For the purposes of this analysis, what matters most is the ability of the land cover classification to correctly identify land cover classes that contain woody vegetation, i.e., the classes forest and other woody vegetation. To assess this ability, the consensus map was re-classified into two classes, namely land cover with woody vegetation (forest, other woody vegetation, covering 46% of the total area) and land cover without woody vegetation (all other classes), and the accuracy assessed by comparing it against the full groundtruth data set. Overall accuracy of this simplified map was 97%, with the sensitivity (i.e., percentage of woody vegetation correctly identified) and the specificity (i.e. the percentage of areas identified as containing woody vegetation that was correctly identified) both >99%. The simplified map is available upon request (please contact CEOBS here).
A2. Mapping areas where vegetation cover or condition has changed
A2.1 Conceptual approach
We chose the Normalized Difference Vegetation Index (NDVI) to track changes in vegetation cover and/or condition over time. The NDVI describes the difference between the amount of near-infrared and red light reflected by vegetation, using the formula NDVI = NIR- RED/(NIR+RED), where NIR is the reflectance of near infrared radiation, and RED the reflectance of red light. It is commonly used to assess vegetation status using multispectral satellite imagery, including in Ethiopia. It is dimensionless and has a range of -1 to 1. Photosynthesising vegetation tends to absorb red light, and reflect near-infrared light, so areas with lush vegetation have NDVI values of close to 1. Areas with only scattered vegetation, or where photosynthetic activity is reduced (e.g. due to a drought), absorb proportionally less red light, and so have lower NDVI value. Bare ground tends to reflect red and near-infrared light evenly, and so has NDVI values around 0. Water has negative NDVI values because it absorbs near-infrared much more readily than red light.
In theory, in areas where woody vegetation has been reduced (either due to clear-felling, or to more diffuse losses), NDVI values should decline. However, in practice, it can be difficult to identify significant changes in NDVI over time. This is because in many ecosystems, including the arid regions of Tigray, NDVI varies with the seasons: For the same vegetation patch, NDVI is much higher during the wet season (when photosynthetic activity is high) than during the dry season. We used the Break for Additive and Seasonal Trend Monitor algorithm (Bfast Monitor) to identify abrupt changes in NDVI dynamics whilst accounting for normal, seasonal changes.
The Bfast Monitor algorithm has been developed to detect significant change that occur towards the end of a timeseries. First, a historical period is defined by the user (i.e. the length of this time period is flexible) during which land cover/vegetation cover is assumed to be stable, and NDVI observations are extracted for this period. The algorithm fits a model to the NDVI observations, allowing for seasonal variations. It also accounts for gradual changes in NDVI year-on-year, such as may occur during slow vegetation change. Then, the model predicts the expected NDVI values during a so-called monitoring period (when an abrupt change in NDVI is expected to have taken place). These predicted values are then compared against the observed NDVI values to determine if the model is still appropriate for the new data, using a moving sums approach. If the observed data is significantly different from the predicted data, a significant change has taken place. It is then possible to calculate the magnitude and timing of this break in the timeseries.
A2.2 Satellite data
There is no long-term satellite data timeseries available that matches the spatial resolution of the satellite data used to map trees and shrubs across Tigray (10 m) across the entire temporal analysis domain (i.e. spanning all years analysed; see Section 2.6), as Sentinel 2A was launched in 2015. Instead, we used satellite imagery collected by the Landsat satellites, which have been collecting data with a spatial resolution of 30 m across the globe since 1984. In Google Earth Engine (code available upon request), we collected all Landsat 5, 7 or 8 Collection 2 Tier 1 surface reflectance data available between 1st January 2018 and 31st December 2021 anywhere across Tigray. This data is atmospherically corrected (meaning the effects of atmospheric haze have been removed). Areas that were covered in clouds (i.e. where vegetation is not visible) were removed by applying the cloud mask that is supplied with the surface reflectance data product. The surface reflectance data is not supplied as their “true” values, but a scaling factor has to be applied first. After applying the scaling factor, NDVI values for each observation were calculated (using bands 4 and 5 for Landsat 8 products, and bands 3 and 4 for Landsat 5 and 7 products).
A2.3 Change detection
A version of the Bfast Monitor algorithm implemented in Google Earth Engine was used with permission of the authors and applied to NDVI observations in each pixel. The start of the monitoring period was set to 1st January 2021. There are several parameters that the user can vary, leading to slightly different outcomes. We assumed that differences in NDVI change between runs of the algorithm with different parameter combinations were likely to be artefacts, and we can be more certain in changes detected regardless of parameter settings. To be able to assess the effect of parameter settings on the NDVI change detection, we ran six variations of the Bfast Monitor algorithm, setting the width of the moving window either to 25% or 50% of the entire timeseries, and varying the harmonics term (which describes the shape of the seasonal variation component) between 1, 2 and 3. We used alpha = 0.05 to determine whether a significant threshold had taken place. This resulted, for each parameter combination, in two outputs: 1) a raster layer containing, for each 30 m by 30 m pixel, the magnitude of change (if any) that had been detected, 2) a raster layer containing the estimated timing of the break in the timeseries. These output rasters were downloaded and further processing took place in the R statistical environment.
A2.4. Identifying areas of declining tree and other woody vegetation cover
The woody vegetation map (see Section 1) was reprojected to match the coarser resolution of the NDVI change analysis. This necessarily introduces some errors, but overall the coarser map adequately reflected where trees and shrubs had been found in 2020. All pixels for any of the change detection analysis outputs were ignored in the following analysis if they had not contained woody vegetation in 2020.
A2.5 Analysis
To estimate the agreement between the varying parameter combinations, the number of statistically significant decreases were counted for each pixel; these could vary between 0 (a statistically significant different was never detected) and 6 (all parameter combinations detected a significant decline). Stronger agreement between parameter combinations was assumed to reflect a higher degree of certainty that the detected decline has in fact taken place and is not simply an analysis artefact. For the purposes of this analysis, medium certainty declines are those where 3 out of 6 parameter combinations agree; high certainty refers to those where all agree. This process was repeated to identify pixels that had undergone significant NDVI increases with medium or high certainty.
Many changes seemed to be detected very close to the start of the monitoring period (i.e. in the first few days of 2021). This could be an artefact of earlier disturbances that took place during the historical period. To assess whether these early breaks qualitatively changed our conclusions, we repeated the identification of medium and high certainty decreases and increases whilst restricting detected breaks to those that had occurred on or after 1st February 2021.
To visualise the analysis results, we aggregated the data in 100 by 100 pixel blocks, leading to 3 km “megapixels”. For each megapixel we counted:
- The number of medium [high] certainty decreases detected, either using all break detections, or restricting them to breaks having occurred later in the year.
- The number of medium [high] certainty increases detected, again using either time period.
- We also calculated the median change magnitude detected in each pixel that had undergone a medium or high certainty NDVI change in any direction (see Figure S1-5).
A2.6 NDVI changes in other years
Steps 2.2 to 2.5. were then repeated for three other years to gauge what, if any, effect the conflict had on changes in NDVI dynamics. To show the potential impact of interannual climate variability on NDVI changes, an exceptionally dry year (2015) and a comparatively wet year (2019) were analysed. The year immediately before the war (2020) was also analysed, to compare post-war to pre-war changes in trees and other woody vegetation. The monitoring period was set to 1st January to 31st December for each year; the historical period was set to 3 full years before the start of the focal year, to match the length of historical and monitoring periods used for NDVI change detection in 2021. This allowed the extent and magnitude of NDVI decreases and increases to be compared between years (Figure S1, S2).
A2.7 Differences in detected NDVI changes between years and change detection parameters
Under the most conservative scenario (high certainty changes after January of 2021), 1.2% of the area that contained trees in 2020 had undergone a significant decline in NDVI (median magnitude: -0.12); this was higher than in 2020 and 2019 (were losses had affected 0.5% and 0.3% of the area respectively), but lower than 2015 (6% of wooded areas underwent significant NDVI declines). When changes that had occurred in January were included, areas affected by significant NDVI declines in increased (to 2.7% in 2021, 0.8% in 2020, 1.9% in 2019, and 6.5% in 2015); but the increase in significant positive NDVI changes was much more severe (e.g. from 6.2% to 17.4% in 2021, Figure S2). This means that the large number of significant changes detected in the first few days of each year primarily affect the extent of detected vegetation cover and condition increases, and not decreases.

Figure S1: Distribution of NDVI change magnitudes. Change magnitudes were estimated using the Breaks for Additive Seasonal and Trend Monitor algorithm, using 6 different parameter combinations (see A2.3 above). Positive change magnitudes indicate a recovery or expansion of vegetation; negative values indicate a decline in vegetation extent or condition. Pixels for which at least 3 out of 6 algorithms detected a decrease, or at least 3 detected an increase, were considered to indicate change with medium certainty; pixels for which either 6 out of 6 parameter combinations indicated a decrease, or 6 out of 6 indicated in increase, were considered high certainty. Overall, more significant changes tended to be detected early in the year, likely a result of trend breaks occurring close to the start of the year (but within the historical period). To ensure these do not affect overall conclusions, the change magnitudes are here also visualised for all changes that took place in February or later in each year (more conservative estimate). Pixels for which different algorithms did not agree (i.e. pixels that were not included in the medium or high certainty category) had smaller estimated magnitudes of NDVI change. Because these pixels are not included here, there is a “gap” in values around the zero value.
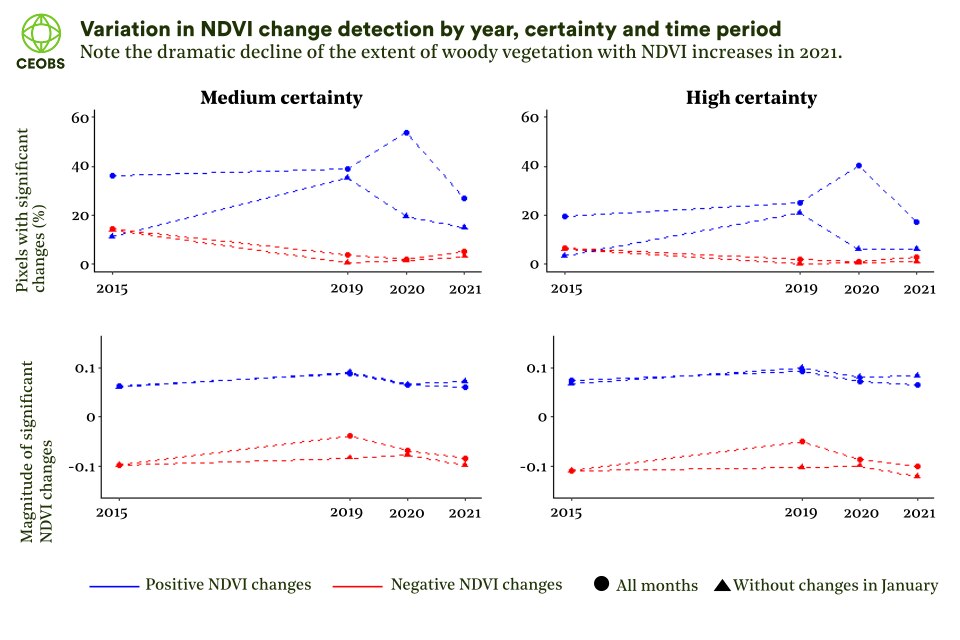
Figure S2: Comparison of areas with woody vegetation affected by NDVI declines and increases across all assessed years and NDVI change detection parameter choice.
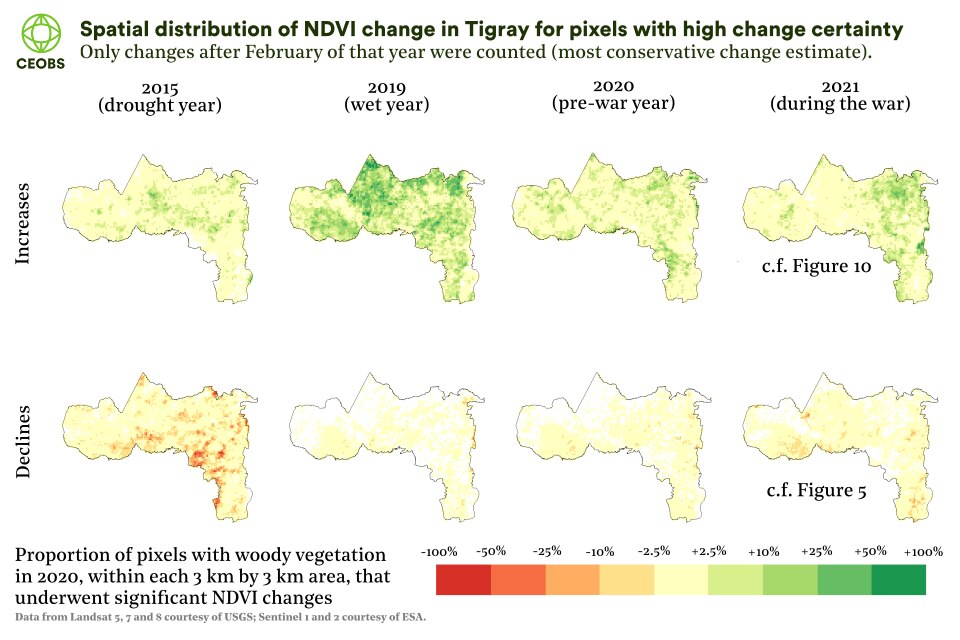
Figure S3: Comparing patterns of NDVI declines and increases between different years. Shown are the most conservative estimates of NDVI declines and increases – only pixels for which the Bfast monitoring algorithm detected a significant decline [increase] for all 6 parameter combinations, and for which this change was detected between February 1 and 15 December (the end of the monitoring period) of each year were counted. This cut-off was chosen to exclude the large number of pixels that showed a significant change within the first few days of each year; most likely an artefact.
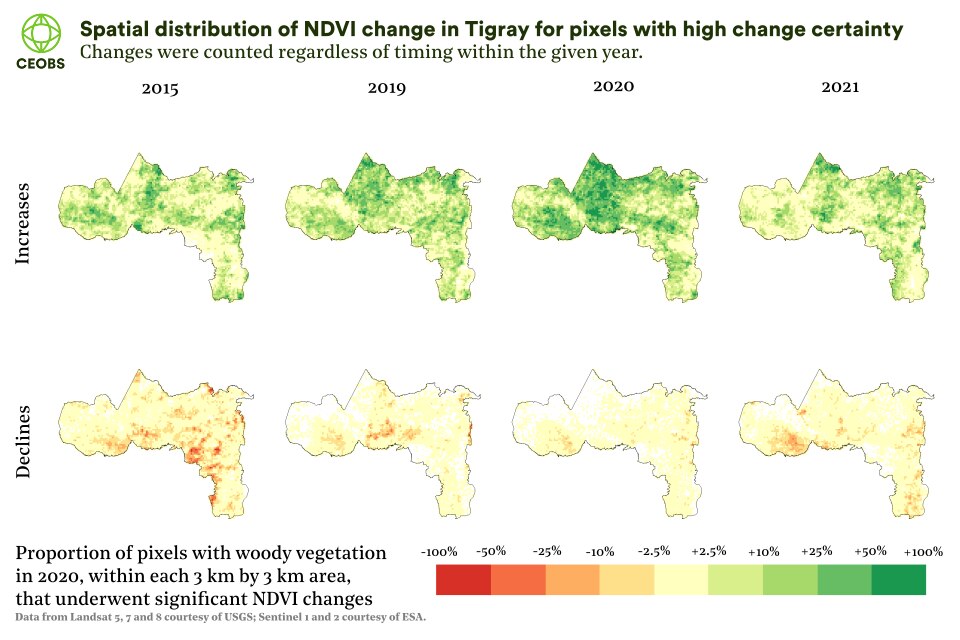
Figure S4: As S3, but showing changes regardless of timing (i.e. all pixels for which the Bfast monitoring algorithm detected a significant decline [increase] for all 6 parameter combinations were included).
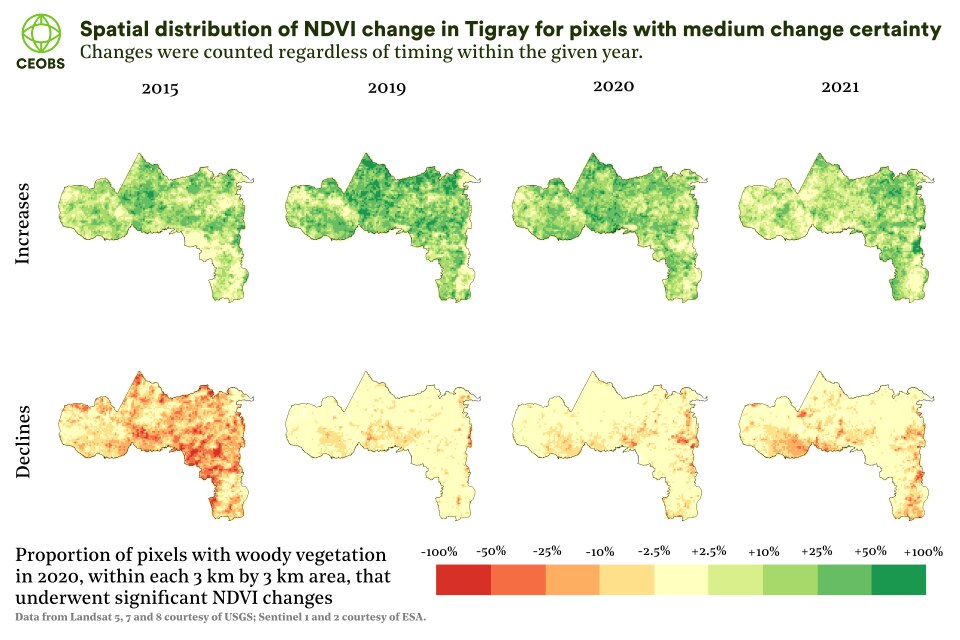
Figure S5: As S3, but choosing a less conservative threshold for determining a significant change in NDVI. A significant decline [increase] was determined if at least 3 out of 6 parameter combinations agreed that a significant decline [increase] had taken place.
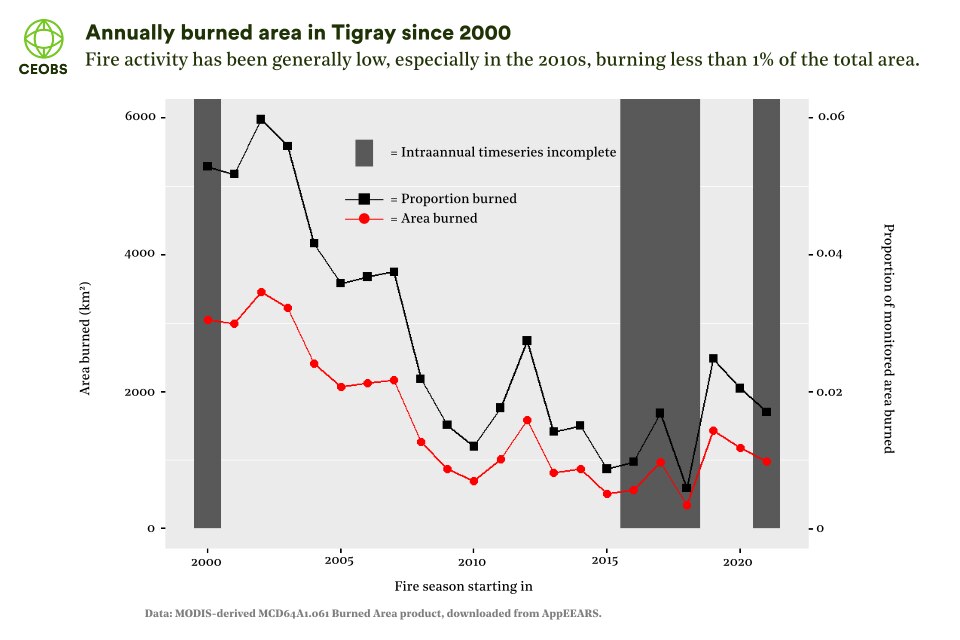
Figure S6: Temporal change in burned area extent and percentage of burned area across Tigray. Note that some years have more invalid pixels, or gaps in the intra-annual timeseries (e.g. due to clouds), than others, so the absolute area monitored changes year on year.
- Based on Birhane et al. 2017 quoting a report by the Tigray Bureau of Agriculture and Rural Development Annual Report 2013. We have not been able to view the report ourselves or verify the extent of exclosures independently.

