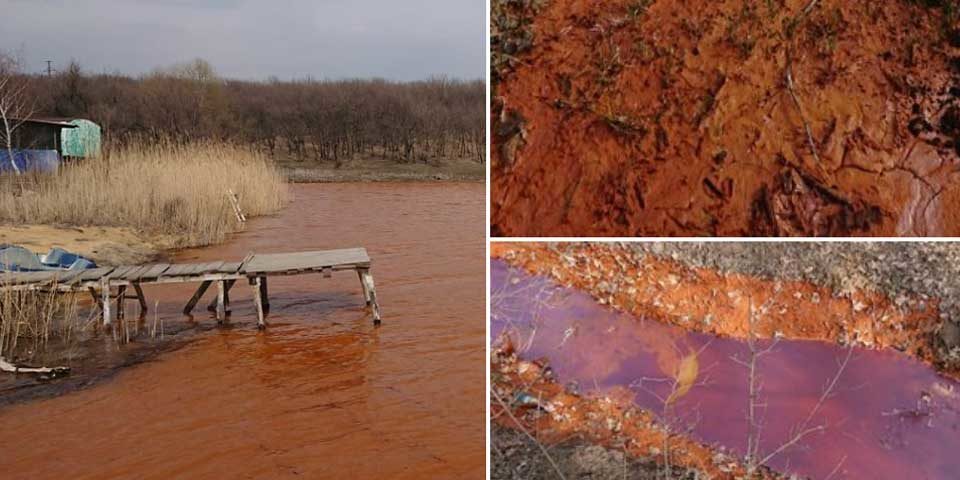
There have been repeated warnings about the environmental risks posed by flooded coal mines in eastern Ukraine, are we now seeing evidence that it is happening?

Power cuts and political choices have seen the abandonment of coal mines in Ukraine’s Donbas region. Mine flooding can cause pollution, increase methane emissions and lead to ground subsidence. In this blog, Eoghan Darbyshire investigates a potential case of mine flooding in a separatist-held area close to a mine that was the site of a nuclear explosion in 1979.
Overview
On the 12th March reports emerged on social media of contamination and discoloration at a reservoir in the town of Yenakiyevo, northwest of Donetsk. A follow up article by Free Radio, a local independent media initiative, suggested the cause was waste-water from an unspecified abandoned mine. Using open source investigations, we have been able to confirm the source as acid mine drainage from the Red October mine (Chervonyi Zhovten in Ukranian).
The flooding may have resulted in acidification and mobilisation of heavy metals into the local groundwater and riverine environment, with potentially significant impacts for human health and wildlife. Of additional concern is that the mine is hydraulically connected to the Yunkom mine, the site of an experimental nuclear explosion in 1979. It is possible that radionuclides may also have been released into groundwater and the wider environment.
The immediate cause of the flooding is likely to have been anomalously heavy snowfall in February followed by rapid melting over a few days. Red October and Yunkom are both abandoned, with no pumping capability. Pumping of the Yunkom mine was intentionally ended by the separatist administration in March 2018. As late April and May typically experience heavy rainfall, even greater danger may be imminent. Further investigations are required as soon as possible to assess the immediate and longer-term risks.
Although industrial contamination of ground and surface waters is not a new phenomenon in the Donbas, this incident indicates the situation may be worsening. The local population may be exposed through both mains water – the Siverskyi Donets river supplies 80-85% of the water used by the regional water provider – and groundwater abstracted from private wells, boreholes and springs. Risks include contamination of potable water supplies, increased ingestion of metals and the potential for acute or chronic health effects depending on the type and level of metal exposure. These can be wide ranging, including damage to organs, the nervous system or increased risk of some cancers.
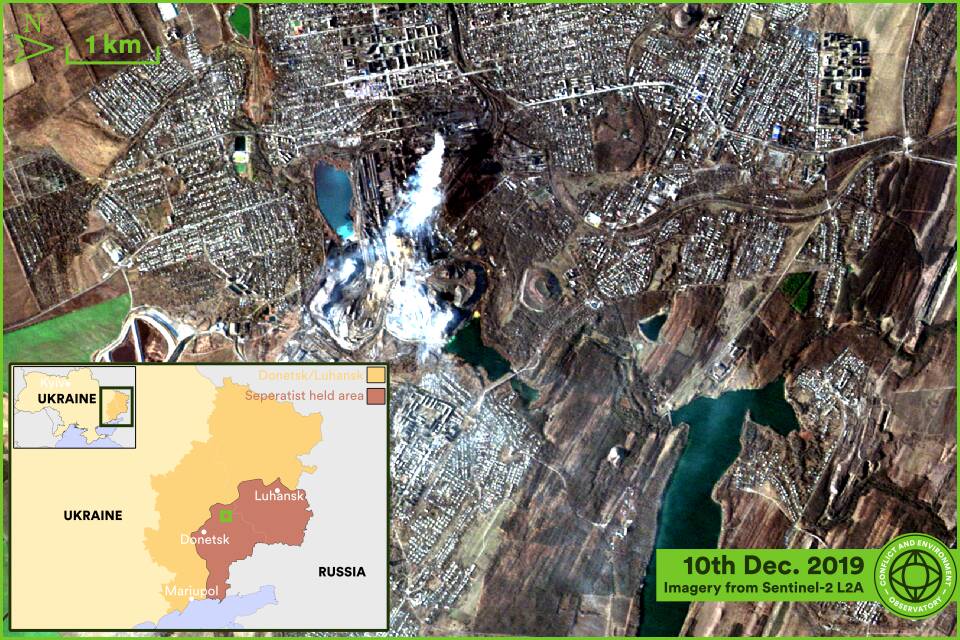

Figure 1. Before and after satellite imagery of the contaminated reservoir, henceforth Kozachiy Pond. Imagery from Sentinel-2 L2A and accessed through the sentinel-hub.com/explore/eobrowser
Determining the source
Although there are many water-bodies surrounding Yenakiyevo, locating the contaminated reservoir was not difficult – Sentinel-2 and Planet imagery show the discoloration very starkly. Given that information on this small reservoir is limited, we have undertaken an open-source investigation to identify the source of the contamination.
The Ukrainian state land cadaster records the reservoir as a ‘settler pond’ and as ‘State property’, whilst Wikimapia lists it as a ‘quarry pond’. For the purposes of this article we will refer to the contaminated reservoir as the Kozachiy Pond, based on the name of the nearest neighbourhood. Looking through more historical satellite imagery, this appears to be the first event of its kind. It seems Kozachiy Pond was used for leisure – at the start 2017 fishing jetties were constructed, whilst the Wikimapia entry shows pictures of people swimming eight years ago.
The change occurred sometime between February 3rd-25th, but persistent cloud cover has prevented identification of an exact date from space. This does indicate precipitation may have played a role and indeed, satellite data reveals 15 cm fell in February – approximately three times more than is normal. The precipitation was in the form of snow until the 24th February,1 when an increase in temperature of approximately 5°C brought not only rainfall but likely rapid snow melt.2
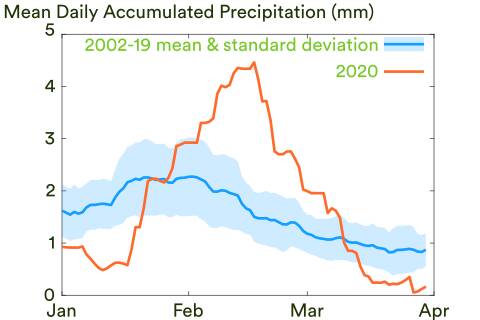
Figure 2. 2002-2019 mean and 2020 daily accumulated precipitation from January to April over the Yenakiyevo region. Analysis using the Integrated Multi-satellitE Retrievals (IMERG) for Global Precipitation Measurement (GPM) data product. Data was acquired and preprocessed through the NASA GIOVANNI platform and can be directly accessed via this link.
Whilst the media report states the source to be an abandoned mine, this could easily be a mistranslation or, given the multitude of industrial sources nearby, a mistake. We have turned to earth observations in order to try identify the source. The potential sources are identified in the interactive map in figure 3 and include: the abandoned Red October mine (also known as Chervonyi Zhovten), the abandoned Yunkom mine, the smelter and coking facilities at the Yenakiyeve metallurgical works, a water filtration station reportedly damaged during the fighting, an abandoned cement works, an abandoned concrete pipe factory and run-off from old industrial tailing piles.

Figure 3. Potential industrial sources of contamination for Kozachiy Pond and nearby water bodies – hover over names for zoomed in detail. Shapefiles created manually based on Wikimapia, Google Maps and the Ukrainian state land cadaster. Underlying imagery of July 2018 from Google Earth.
Identifying the source using elevation
The first clue for identifying the source comes from high-resolution imagery in Google Earth. At the easterly most point of the Kozachiy Pond we have identified the inlet pipe. By assuming 1) this is the only water source (besides run-off) into Kozachiy Pond, 2) that it comes from only one source, and 3) the Kozachiy Pond is gravity fed, then potential locations below the level of the Kozachiy Pond can be discounted. Furthermore, the probability of the source being just above the level of Kozachiy Pond but a large distance away can be down-weighted.

A Digital Elevation Model helped to identify the areas below the pipe. Most of the metallurgical works are below the level of Kozachiy Pond, with the exception of the coking plant and some of the tailings. However, there is a large distance of approximately 3km when accounting for undulation, between these and the contaminated pond. This makes the metallurgical works (coking plant, smelter) unlikely sources.
Can we use historical imagery?
Another avenue to explore in identifying the source is historical imagery. If Kozachiy Pond was built at the same time as one of the other facilities then it is likely they are the source. The imagery in Google Earth stretches back to 1984, when we can still see Kozachiy Pond, although the spatial resolution degrades to such an extent it is difficult to see any finer detail. For example, it appears the buildings of the water filtration plant are not in the current configuration in the 1990’s but we cannot say this robustly.
Fortunately, for earlier periods there is a tranche of high-resolution images of the region from an unlikely source – declassified US spy photography. Whilst most of the declassified images cost $30 each, a few are freely downloadable and it is these we use here. The tricky part of this analysis step is to georeference the images – fortunately the open-source QGIS software allows us to do this with relative ease.

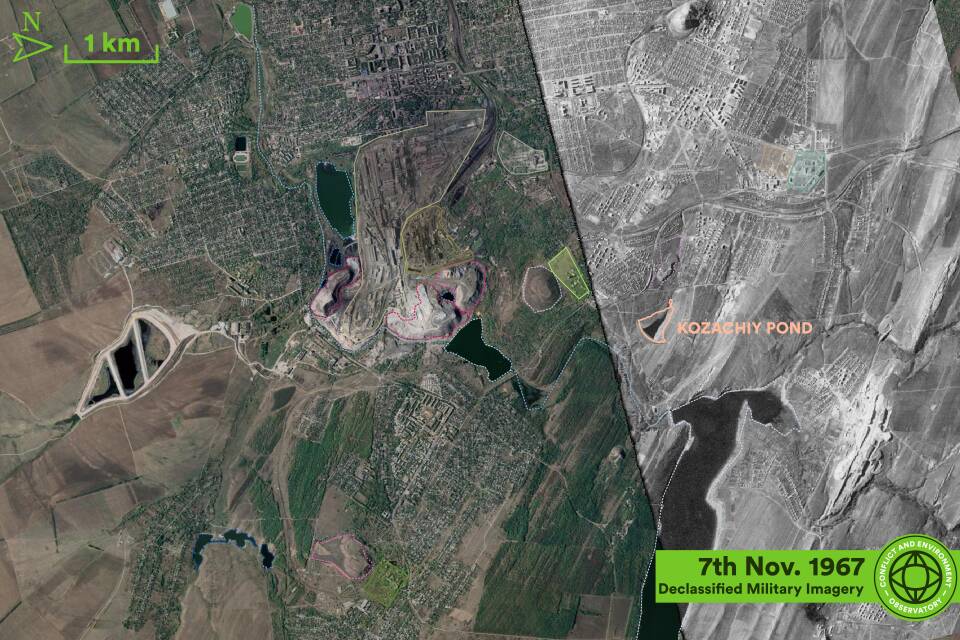
Figure 5. Historical imagery over Yenakiyevo from declassified US military satellites. Both images are from the first release of data from the CORONA, ARGON, and LANYARD satellites with photo ID’s DS009032024DF069 (1962) and DS1044-1072DA068 (1967). Imagery georeferenced in QGIS with the underlying Google Earth imagery from July 2018.
The first imagery from 1962 shows that the Kozachiy Pond is yet to be built. The now abandoned mine is in operation though, as can be seen from the tailing pile which is starting to accumulate, and it appears that there is a drainage stream into the Bulavyna River. Neither the concrete works or water filtration plants are in operation, at least in their current configurations. Unfortunately, it is not possible to determine if the cement works are operational as the photograph is too saturated. The metallurgical works is off camera and thus we don’t know the scale of operations, though they are likely to be significant.
Using the spectral signature of the pollution
By measuring at visual wavelengths, the Sentinel-2 sensor provides easily understandable photo-like ‘true colour’ imagery as seen in Fig. 1. However, the sensor provides much more information by also measuring at other wavelengths, in the infrared, ultra-violet and microwave. Surface features reflect and emit energy from the sun uniquely – their ‘spectral signature’ – and we have tried to understand the signature of the Kozachiy Pond in order to identify the nature and source of the contaminants.
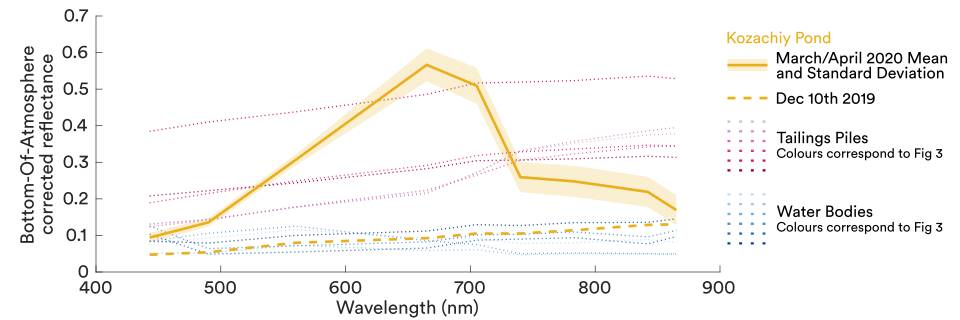
The spectral signature of the Kozachiy Pond shows a very strong reflectance at 650 nm – this is unlike the nearby water bodies and the tailing piles, ruling both out as possible sources. For further direction we turned to the USGS high-resolution spectral library, which contains reference spectral signature for minerals, rocks, soils, man-made materials, plants and microorganisms.
The main drawback with comparisons to the USGS library is that the reference spectra are from dry samples, not dissolved in water. As water absorbs very strongly beyond approximately 700 nm, this leaves only the first six bands for comparison. We matched the spectral signal from Kozachiy Pond to the closest reference signature using three techniques: spectral angle mapping, spectral information divergence, and Fréchet distances.
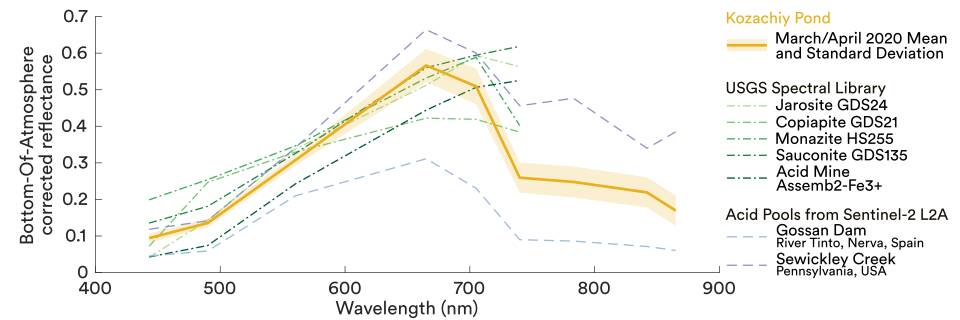
The spectral signature of Kozachiy Pond closely matches Jarosite and Copiapite, minerals produced following oxidation of iron sulphides. These are associated with acid mine drainage, a phenomenon that contaminates groundwater and river systems in many former coal-mining regions. Indeed, the spectral signature from two well studied acid mine ponds in the US and Spain match closely to that of Kozachiy Pond.
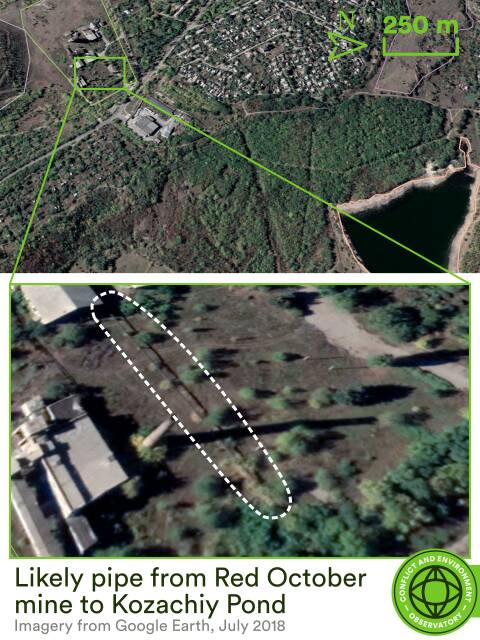
Following our analyses of elevation, distance, historical imagery and spectral analysis, it seems that the probable source of contamination in Kozachiy Pond is the abandoned Red October mine. Thoroughly scrutinising the mine using Google Earth even shows a pipe exiting in the direction of the pond, a final piece of evidence.
The implications of mine flooding
The above average snowfall and rapid melt likely flooded the mine, with the floodwater escaping into the Kozachiy Pond. The mine has been abandoned since 1992 and although the importance of keeping mines dry is well understood, pumping of floodwater likely ceased during the conflict, as elsewhere in the Donbas.
The acid run off from the mine can dissolve heavy metals contaminating groundwater and rivers – the exact metals depend on the local geology and mineralogy of the acid solution. Flooding of mines can also result in methane explosions in cellars of homes and factories and cause severe subsidence. Release of mining and industrial effluent is a widespread problem across the Donbas, but new incidents such as this indicates a worsening of the situation. Indeed, a brief sweep across the contested area with Google Earth reveals many ponds and reservoirs where there is a suspicion of contamination. The existing issues and continuing environmental risks across the Donbas as a result of the conflict have been well identified in a number of reports and articles, for example by the OSCE.
If the mine shafts remain fully flooded and the Kozachiy Pond remains at full capacity, what will be the fate of the acid water upon further sustained rainfall? A particularly rainy period usually occurs between the end of April and the beginning of March. One would expect the Kozachiy Pond to flood into surrounding forestry and then downward into the Bulavyna river, especially if precipitation is anomalously high, as in February. What’s more, many other abandoned mines in the Donbas may be overwhelmed, creating a serious environmental problem throughout eastern Ukraine.

A further and potentially very significant complication arises given that the Red October mine is not isolated – belowground it is interconnected to nearby mines. In particular it is hydraulically connected to the Yunkom mine, less than 4km away, which contains the by-products of a Soviet experimental nuclear explosion in 1979. Very little is known about the explosion and the current state of radioactive material – it ought to be contained within a sealed concrete chamber at the bottom of the mine (903 m), and was designed to remain dry. Since the mine was intentionally flooded in 2018, finding robust information is difficult given the claims and counterclaims by the conflict parties. However we know the chamber is now wet and inspections in 1991 and 2001 found water admissible cracks in the chamber, consistent with testimony from those involved at the time.
Attempts to model the chamber under different abandonment scenarios in 2017 found there was insufficient geological data for robust conclusions, although they indicated that the hydraulic migration of radioactively contaminated water containing strontium-90, caesium-137 and tritium was possible. In particular, figure 4 shows how the mines are hydraulically connected and there are routes for radionuclide migration at 3 horizons.
The flooding at Red October may indicate an increased probability of mobilising radionuclides from the nearby Yunkom mine. Whilst this probability may well remain small, given the scale of the risk, it is time for local and regional actors to come together to properly characterise this hazard with the necessary resources.

Latest imagery
A quick examination of the latest satellite imagery shows small ponds in the vicinity of Kozachiy Pond with a similar yellow/orange hue and spectral signature. This change has occurred during the preparation of this blog. Whilst the sources may be different, and an investigation similar to the above is outside the scope of this work, it might be indicative of more widespread mine flooding, further highlighting the urgent need for on the ground monitoring.
Dr Eoghan Darbyshire is CEOBS’ Researcher. Our thanks to Dr Nickolai Denisov, Dmytro Averin and Dr Iryna Nikolaieva for their feedback on this investigation.
- By looking through each day in February on the NASA Worldview platform with the IMERG Precipitation rate layer
- Based on surface daytime air temperature retrievals from the Atmospheric Infrared Sounder. The data can be plotted and accessed via this link to the NASA Giovanni platform

