Yemen’s agriculture in distress: A case study of wadis Zabid and Rima, the Tihamah
Published: October, 2020 · Categories: Publications, Yemen, Agriculture
Introduction
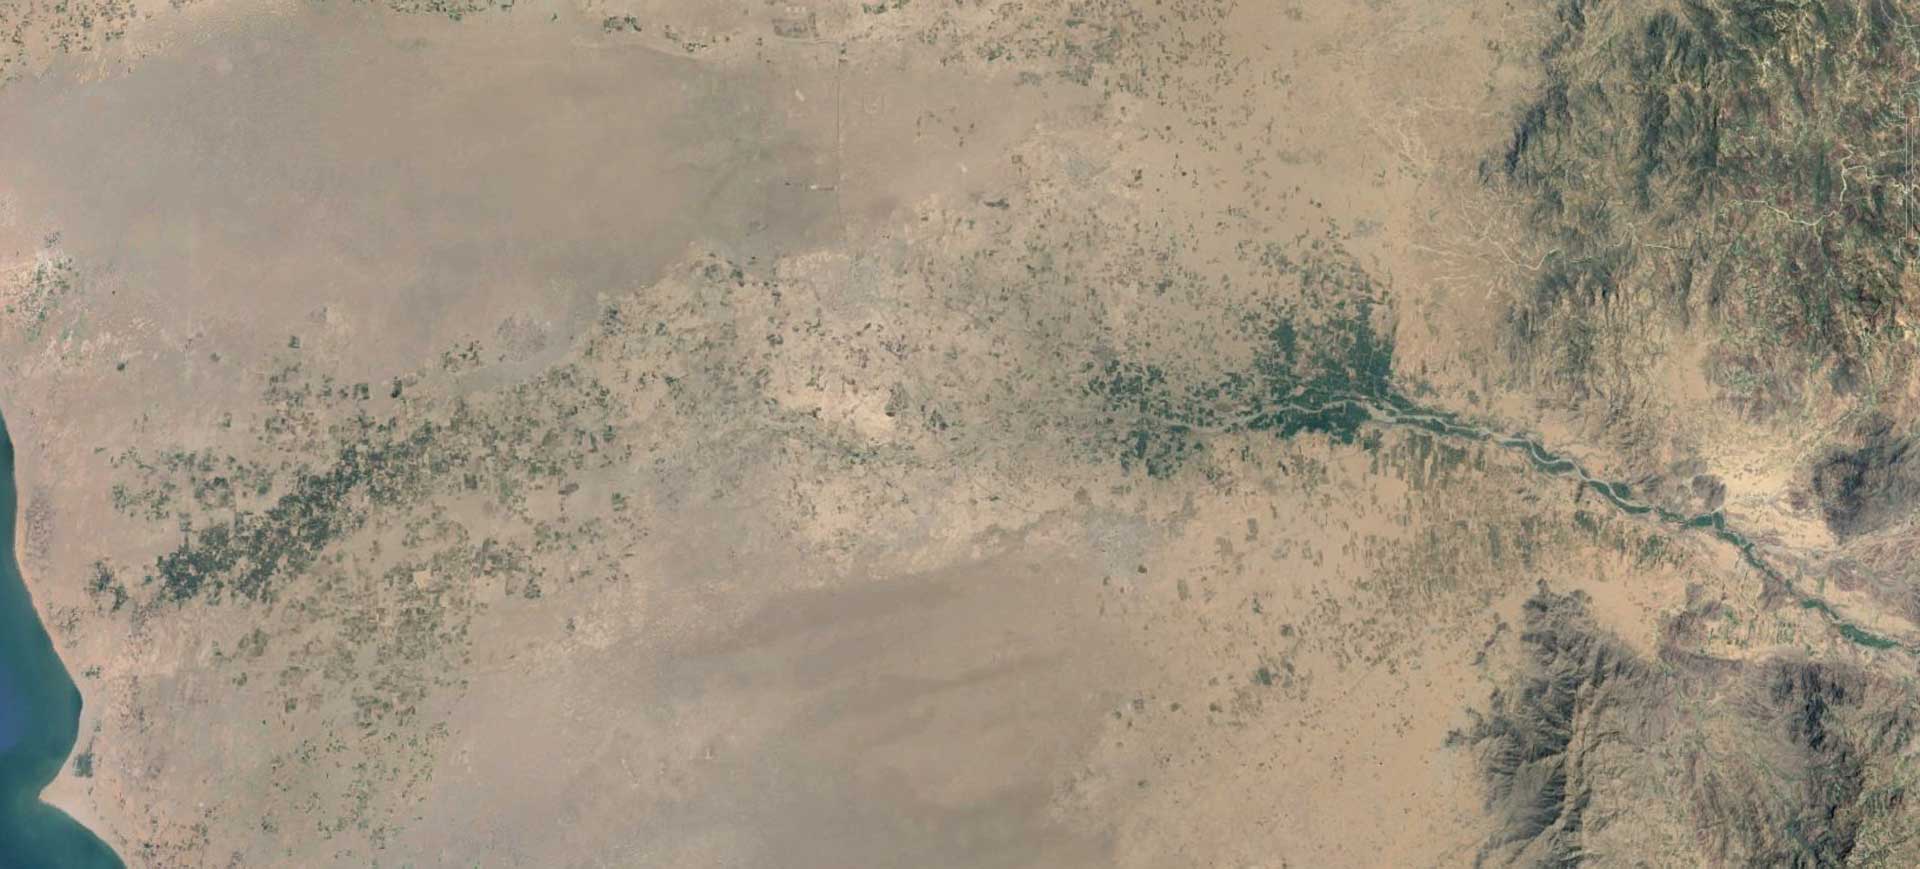
In our analysis of the condition of Yemen’s agricultural areas, one area stood out as particularly impacted – wadis Zabid and Rima in the Tihamah ‘breadbasket’. Traditionally this area has grown a great diversity of fruits, vegetables, cereals, fodder crops and cash crops – such as cotton and henna. Rainfall along the coastal plains is scarce and, although farms in the foothills can access spate water, the majority of farms in the down and mid-stream areas are reliant on groundwater – especially for water-intensive fruit crops.
Using open-source datasets, Eoghan Darbyshire takes a deep dive into the situation that has unfolded in this area, and analyses the complex relationship between the conflict and the deteriorating agricultural situation.
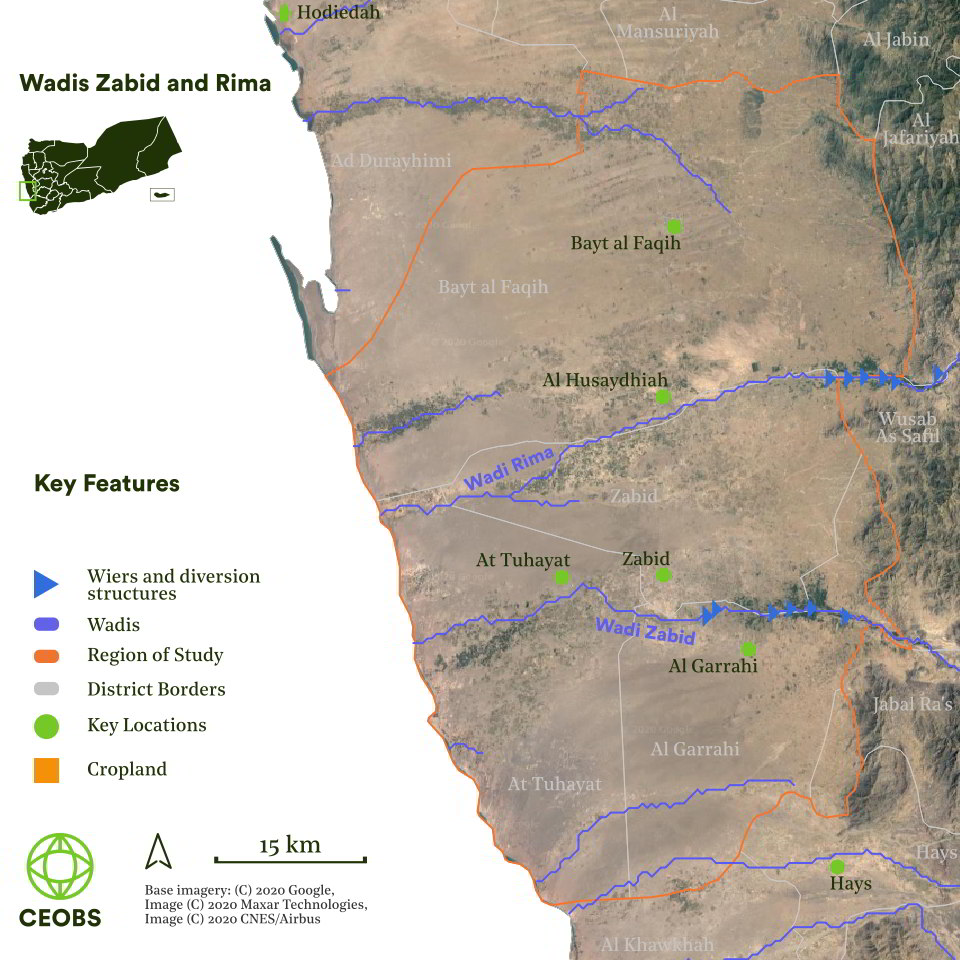
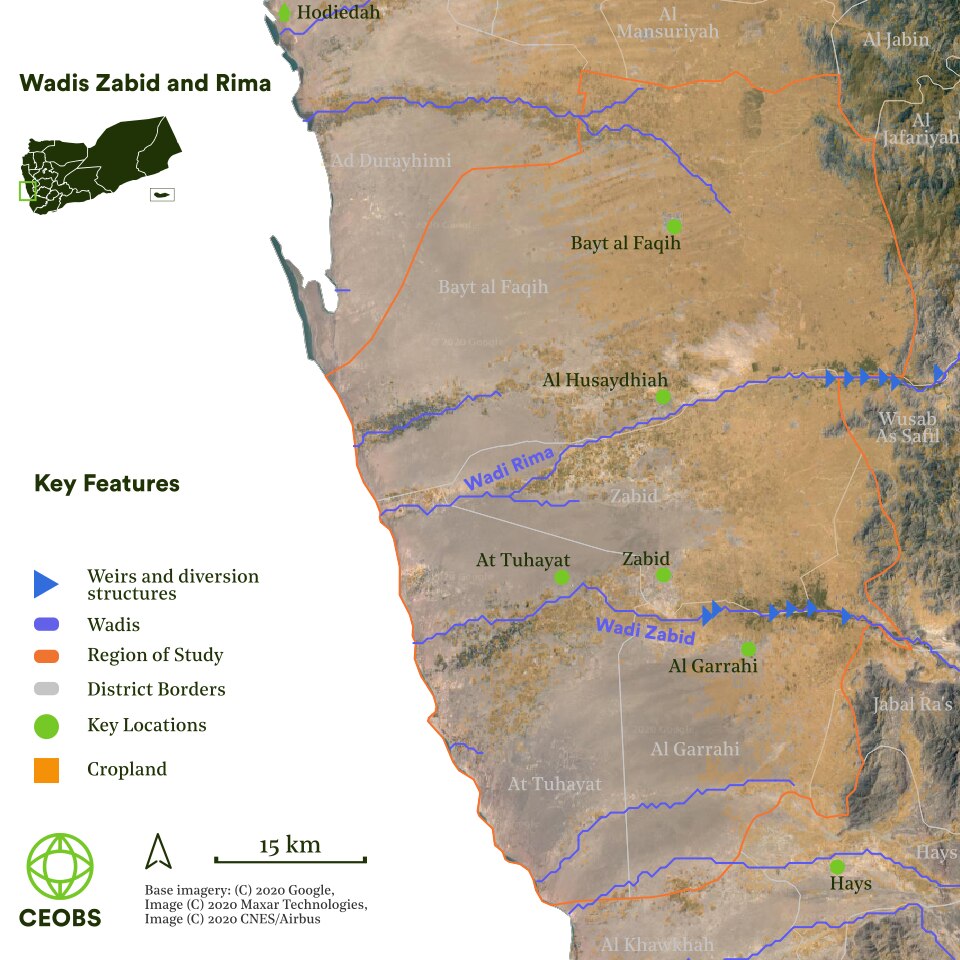
Figure 1. Map of key features and region of study. The slider shows the area with and without a cropland extent flag.
Contents
Observed agricultural decline
In total 46% of the cropland area in wadis Zabid and Rima is in distress, equivalent to 751km2. This is based on our agricultural distress index, which captures where there have been significant biomass losses between the pre-conflict period (2009-2013), and the period during the conflict (2014-2019). The index incorporates changes in both total-biomass and relative-biomass, which accounts for inter-annual variability in the weather, as well as where the discrepancy between the two is particularly large. The total-biomass losses in and around the wadis have been in the down- and mid-stream areas, whilst relative biomass losses are throughout the region of study, including the up-stream areas.
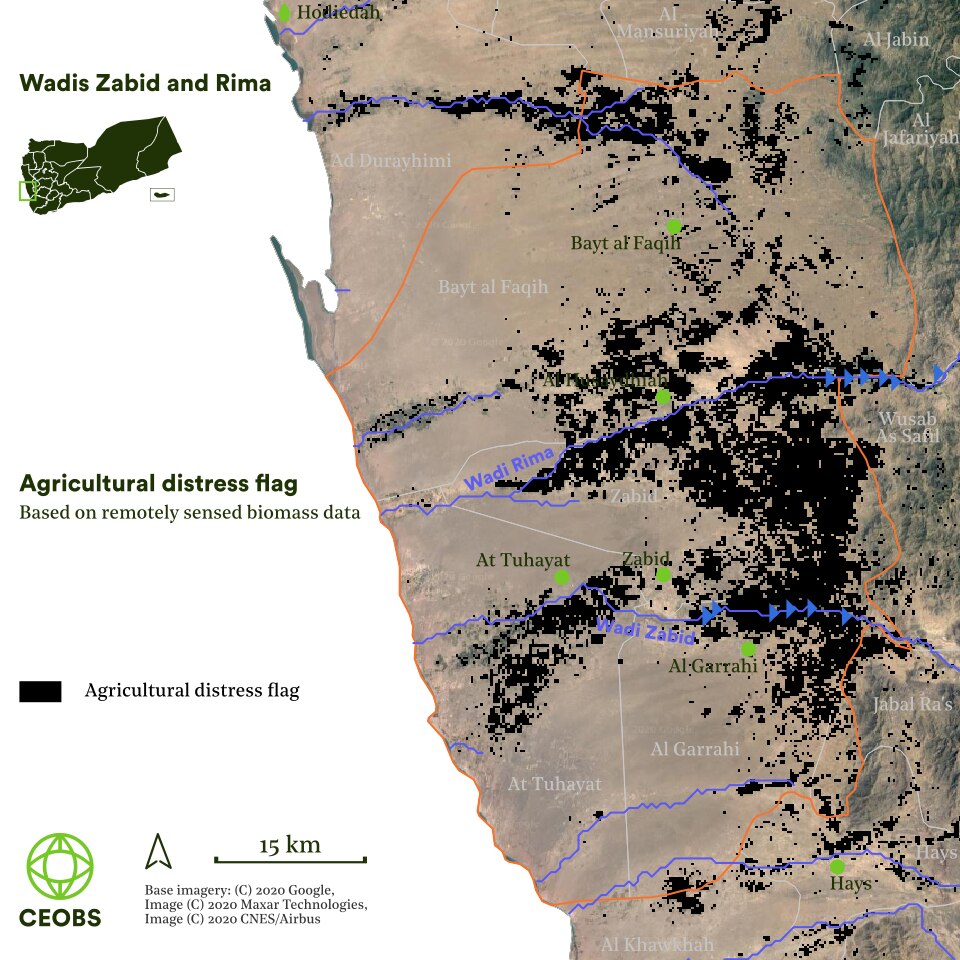
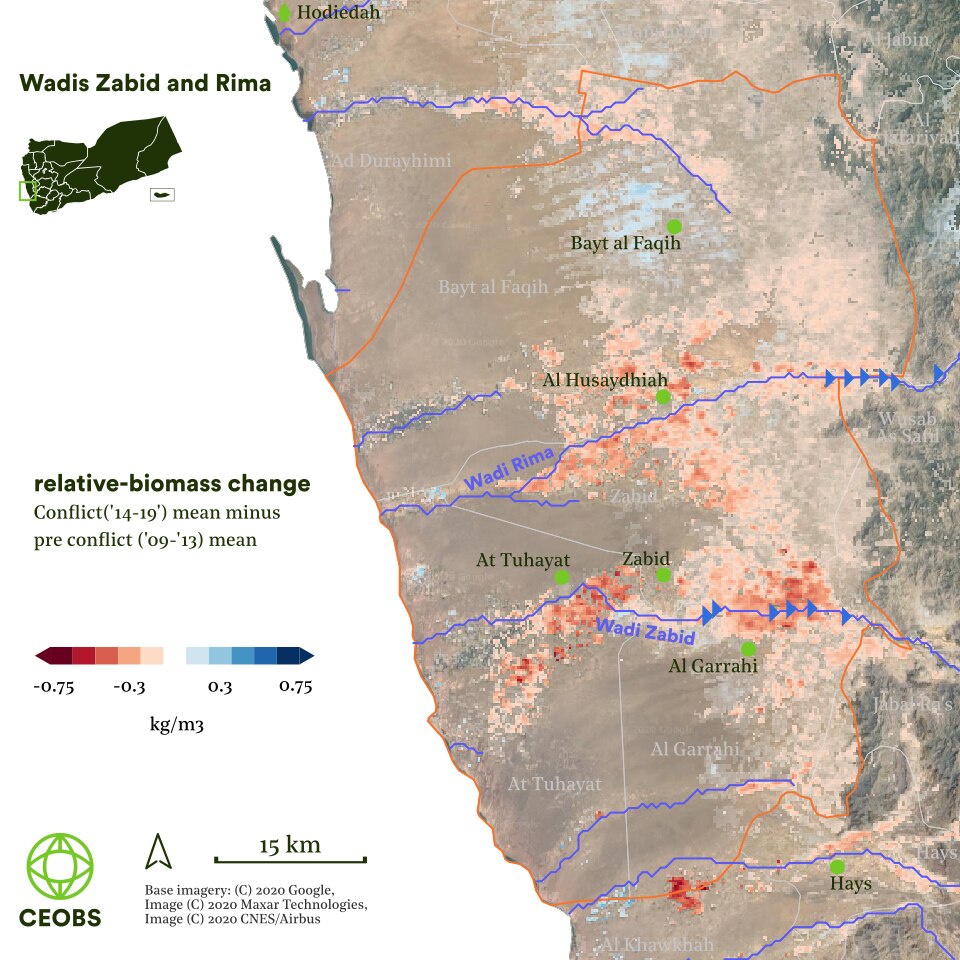
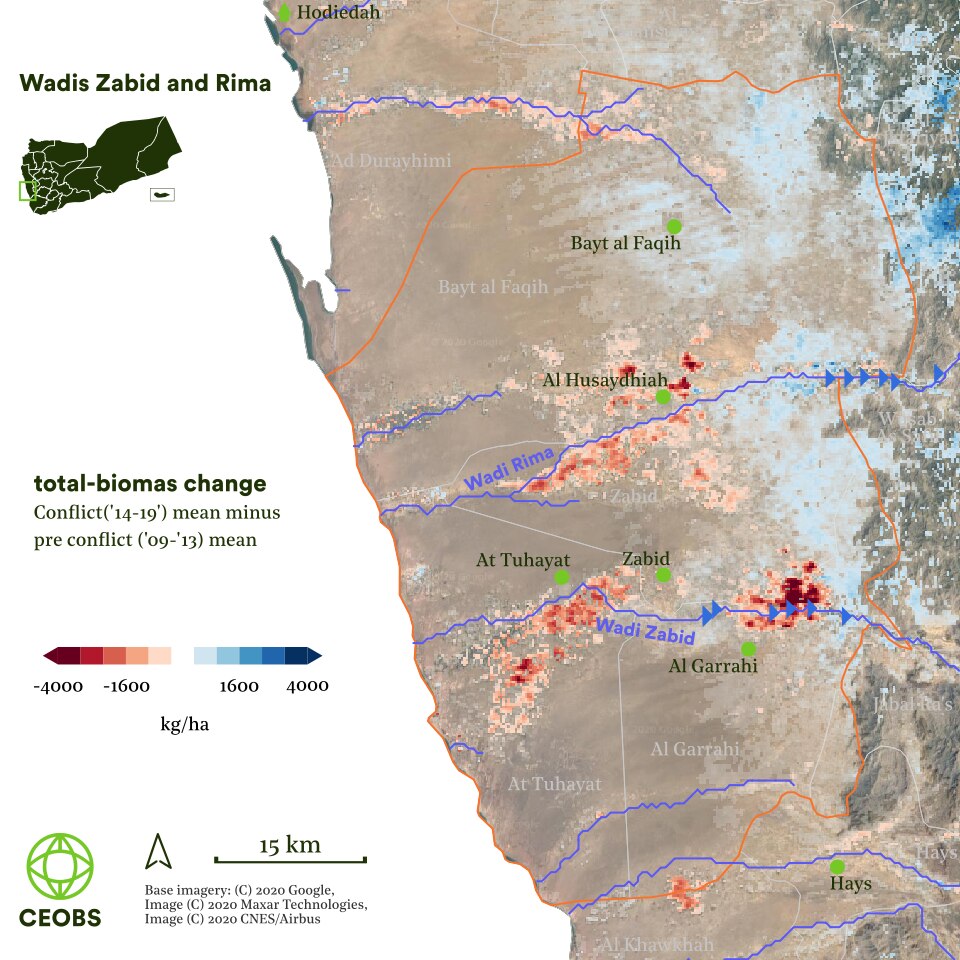
Figure 2. Agricultural areas in distress and mean biomass changes
At this more local scale, it is easier to bring in supplementary higher resolution data products to validate our agricultural distress index and open source reporting. For example, the use of Synthetic Aperture Radar (SAR) allows us to show the individual farms that have experienced the greatest changes. Although a very different measurement type,1 and comparing over a slightly different period, Fig. 3 shows a broad agreement between the SAR and total-biomass changes pre to during-conflict.
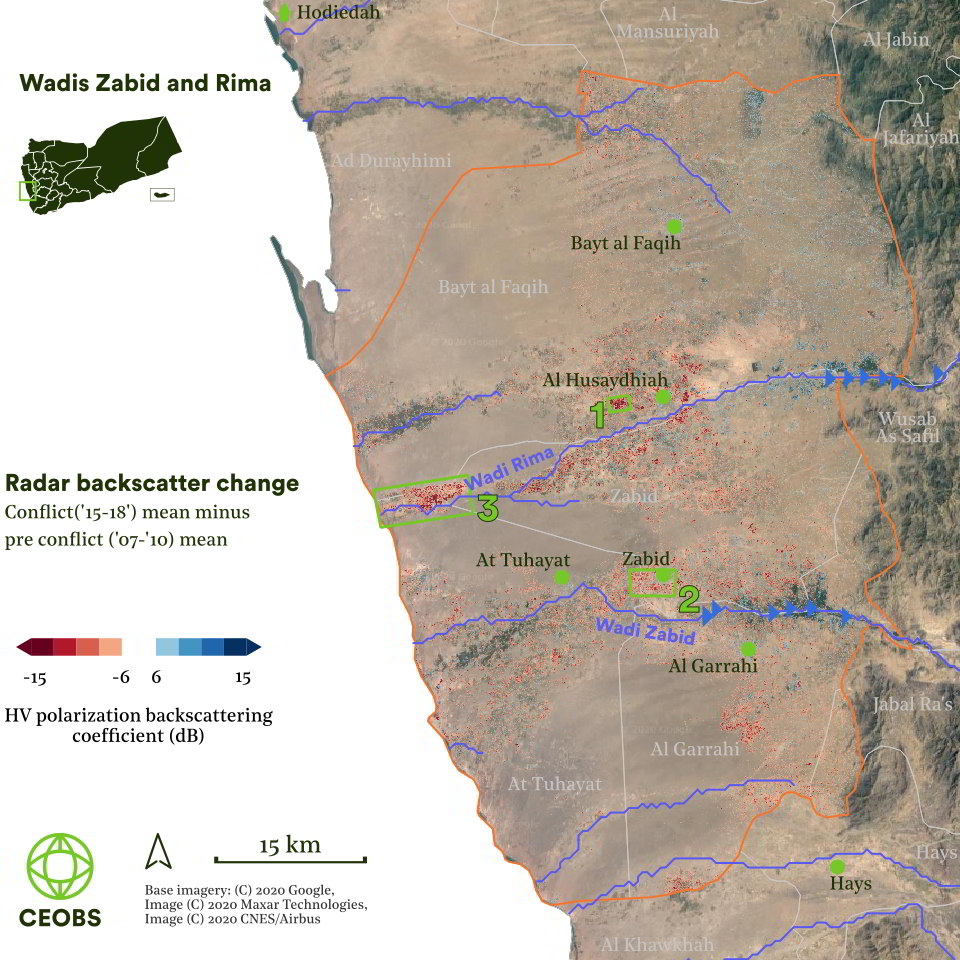
Figure 3. Change in the radar backscatter coefficient between the pre-conflict (2007-2010) and conflict (2015-2018) periods. To view a zoomed in version of the case study areas, hover your mouse over a number. n.b. these time periods differ from the other biomass products owing to data availability constraints.
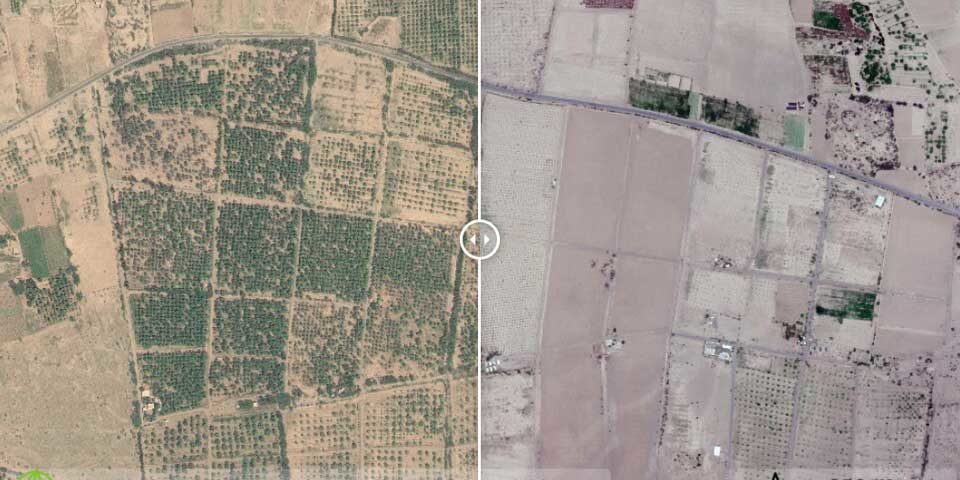
To show these changes more tangibly, we have compiled before and after high resolution imagery from three of the worst affected areas. To ensure the changes are simply not from harvesting practises we compare historical imagery from the same time of year – autumn. 2
The first case is a relatively large farm in downstream Wadi Rima, which from the regimented layout and circular crowns we can deduce is an orchard – likely mangos, bananas or dates. Nearly all of its fields are barren by 2018. Zooming in there are darker patches where the trunks would be – likely to be bare dead trunks. We have been unable to find much information about the farm, other than a 2007 entry on Wikimapia, which lists it as (translated): The farm of the late Mohamed Ahmed Al-Ansi. Given the scale of the farm, it is possible it belongs to a land-owner and was farmed by tenants. Intriguingly, in the most recent imagery from September 2019 (not shown) there are some signs of recovery in the vicinity, including the installation of solar panels, presumably to abstract groundwater. Indeed, a search of YouTube videos geotagged near the farm shows solar powered irrigation – whilst this may not be the farm in question, it suggests that there is renewed investment in at least some agriculture in the wadi.
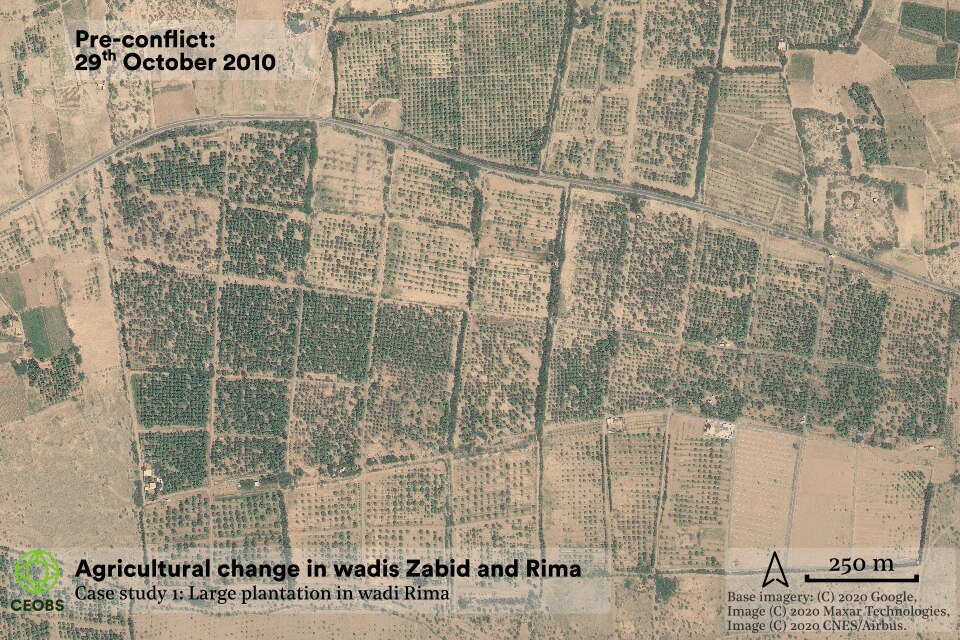
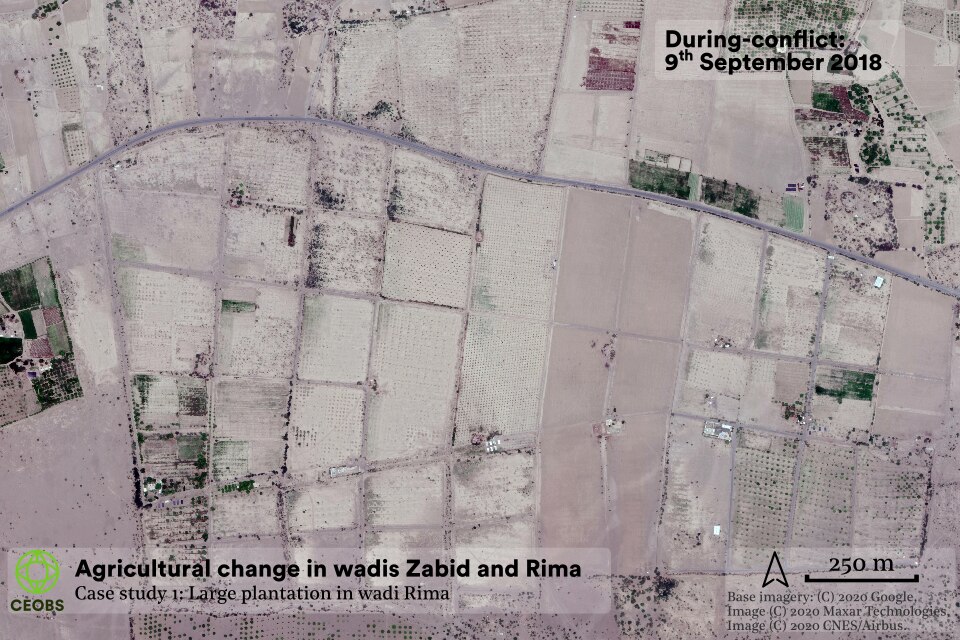
Figure 4. Desertification of large scale fruit farm in down-stream Wadi Rima.
The next case are the smaller farms surrounding the town of Zabid, likely growing cotton, cereal or vegetables. Again, by 2017 many of these fields lay empty – and in stark contrast to those that have retained some crops. The fields in the north of the frame show visible ingress of sand-dunes, indicating desertification.
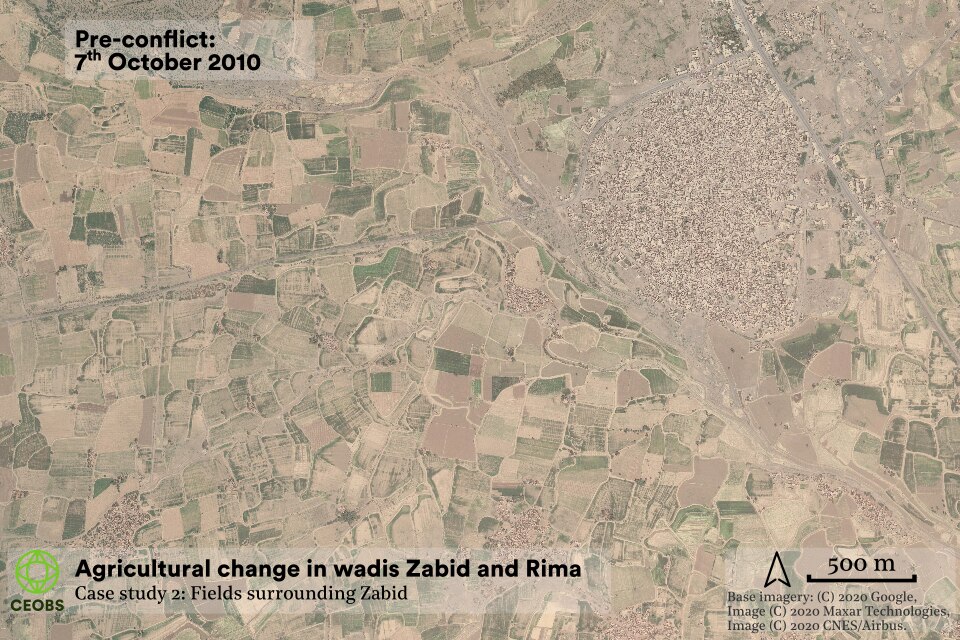
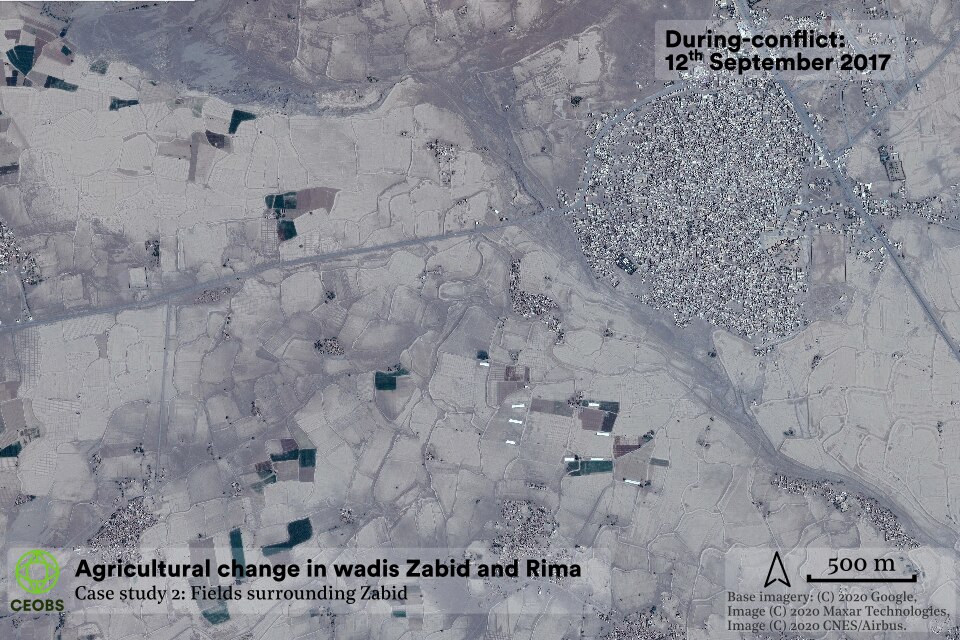
Figure 5. Crop abandonment of small farms and ingress of sand-dunes around the town of Zabid.
Finally, a case where natural vegetation 3 has been converted to cropland, presumably to make use of the fresh water resource supporting the vegetation. Furthermore, the felled vegetation will have acted as a valuable fuel source, with firewood use increasing by approximately a third in Wadi Zabid.
This area doesn’t appear in the ‘agriculture in distress’ index, as it is occurring on natural vegetation. However, it is perhaps indicative of the pressures on agriculture in the wider area to expand into areas with fresh water – presumably by a finite amount before salt water ingress occurs to the shallower coastal aquifer. This is a fate that has previously afflicted the date palm area of Al-Mujellis, just to the south, and is currently affecting the Al-Jah region to the north.
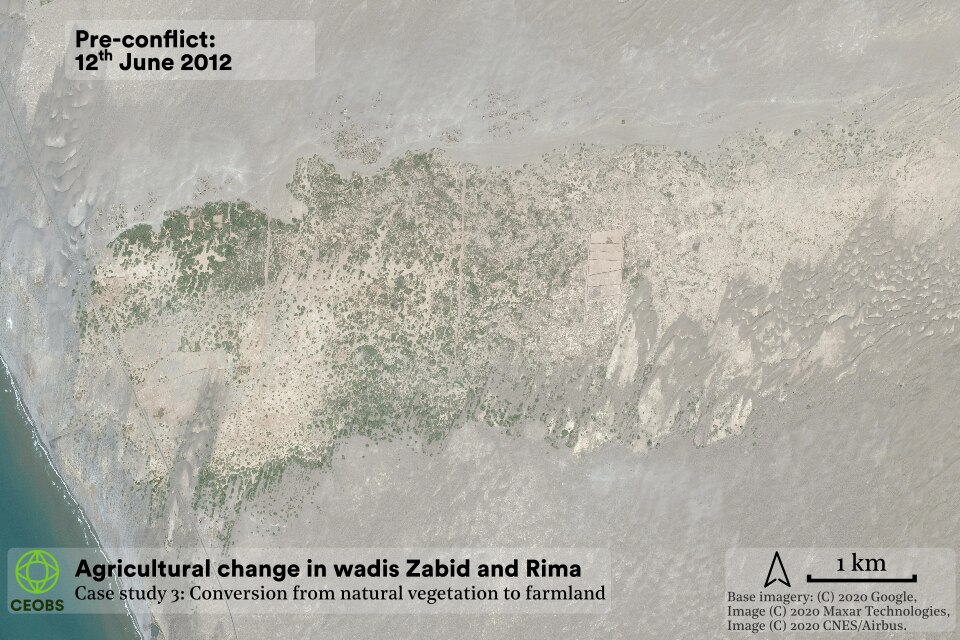
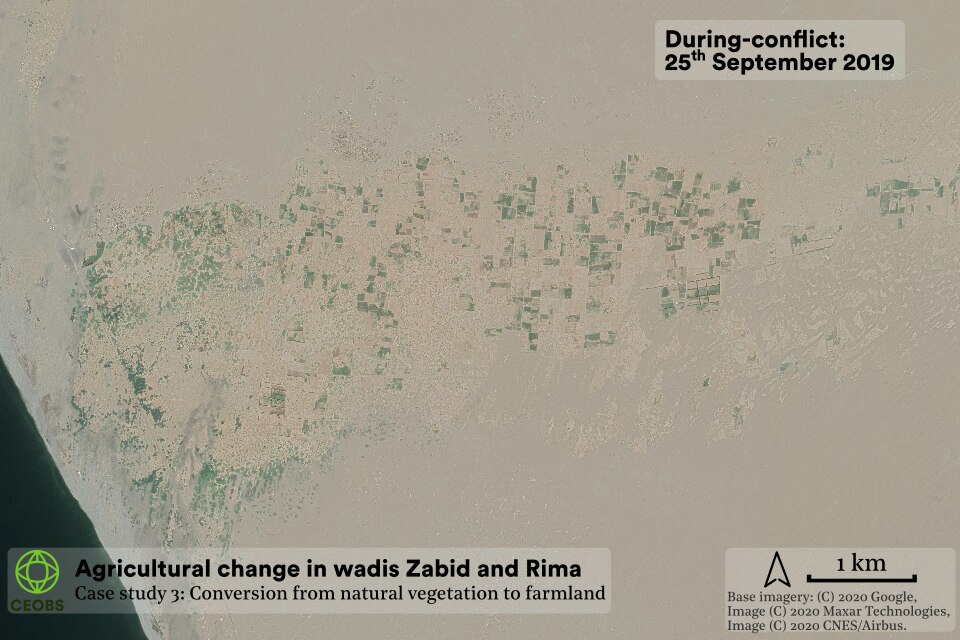
Figure 6. Conversion from natural scrubland to small farms in the coastal area of wadi Rima.
In spite of searches for geolocated tweets, photos and articles, very little detailed information could be found on these case study sites – partially because the use of social media is not as widespread, nor on the same platforms, as in other locations. This shows that for Yemen, to get hyper-local information it is necessary to use local sources. Indeed, our remote-sensing based perspectives are corroborated by reports from on the ground. Agricultural losses in Wadi Zabid were identified previously in a 2017 analysis by the Flood-Based Livelihoods Network Foundation (FBLNF). This study conducted household surveys and determined that the conflict had reduced yields of sesame, cotton and tobacco by 59%, vegetables by 53% and fruits by 44%. The study also estimated the area under cultivation to have fallen by 51%.
These findings are in good agreement with official figures from the Ministry of Agriculture (MAI) for Hodeidah governorate as a whole, which also show a drop in production and the area under cultivation, particularly of cereals and vegetables. Curiously, these same official statistics show a huge improvement in 2019 compared to 2018. We treat this increase with some scepticism, as although there was an increase in biomass as seen from space in 2019, the scales are not consistent. The MAI is based in Sana’a and under Houthi control, and therefore liable to political manipulation; this may not be the case here, but such a risk is one of the problems of using data from conflict parties.
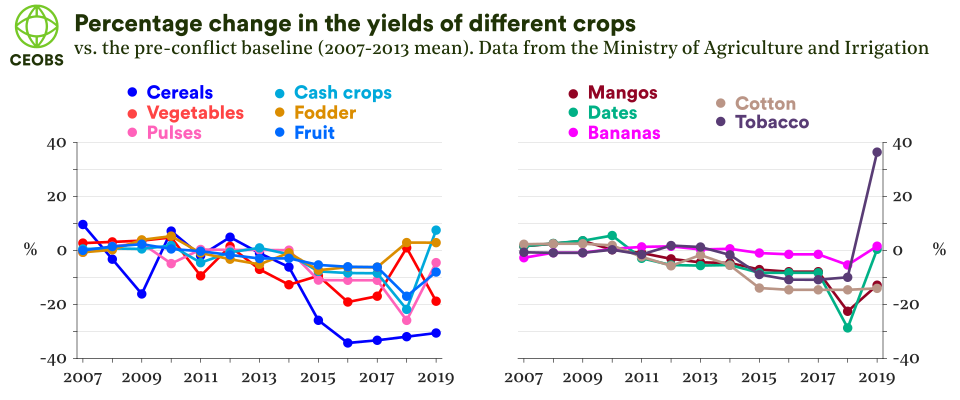
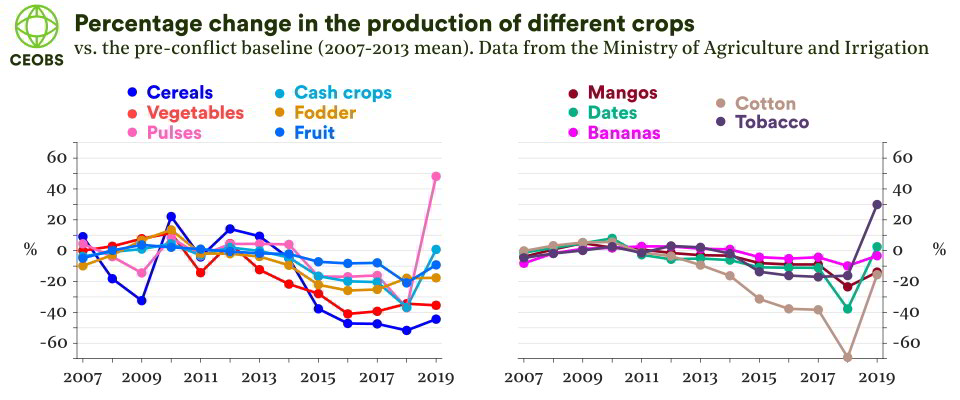
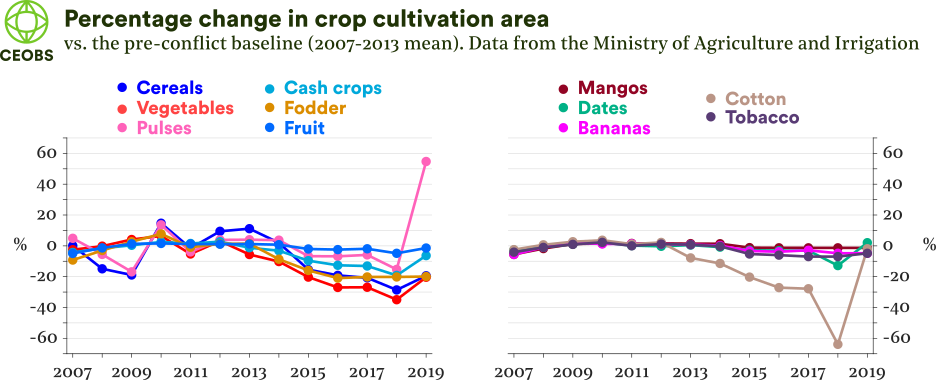
Figure 7. Changes to crop production, yield and area (7a, above), and livestock and bee numbers (7b, below) in the Hodeidah governorate based on official data from the Sana’a based Ministry of Agriculture and Irrigation (MAI) year books 2011-2019.
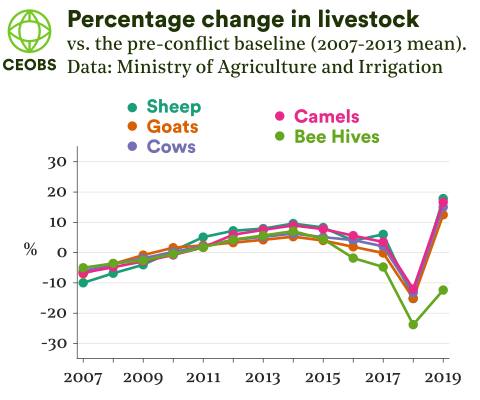 Sheep, goats, cattle, camels and poultry are a particularly important income source to the rural population and were increasing in number before the conflict. The conflict has reversed this trend and a 2018 FAO report provides two potential explanations for this.
The first is environmental; access to watering and feeding systems has been disrupted, resulting in malnourishment and the necessity to sell before death, whilst there has also been the spread of endemic diseases such as peste des petits, sheep and goat pox, and foot-and-mouth disease. The second is economic; this includes the rising cost of fodder and unavailability of veterinary or husbandry services, but is primarily related to easing hunger – there has been a 50-80% rise in livestock sales at prices 30-50% lower than the norm as people have strived to cover the increasing cost of food.
Again, these statistics are consistent with official numbers from the MAI, showing by 2018 a steep decline in livestock numbers by approximately 20% compared to pre-conflict. The 2019 data again arises suspicions though, for example the increase in sheep numbers by approximately 350,000 in a single year for one single governorate seems unrealistic, especially given the economic war.
Indeed, and as in many other parts of the country, the food security situation in wadis Zabid and Rima has been acute and chronic. According to IPC acute food insecurity assessments for Hodeidah governorate, between late 2014 and mid-2015 the number of people at crisis level or above4 increased by more than 1 million people. This jumped by a further 450,000 between late 2016 and early 2017.
At the last country-level assessment in January 2019, 1,126,500 people were at crisis level in Hodeidah governorate, 558,500 were at emergency level and 6,000 were at famine level. The most recent assessment in early 2020 could only conduct surveys in the At Tuhayta district, but found that 50% of the population were at crisis level or above. It is a cruel irony that these jumps in food insecurity, mainly caused by economic blockades, have occurred at the same time as the biomass losses: at the very time domestically grown food is most needed, its production has dropped.
Historical context of agriculture in the wadis
Wadis Zabid and Rima both have complex water access issues and a history of local conflicts. Historically, agriculture in the wadis relied on spate irrigation – the capture and storage of seasonal rains, rivers and floodwater in ponds, lakes, canals and dams for controlled release. Spate agriculture is an ancient and sustainable practise, but as a management technique does carry a high flood risk and is often managed with complex water usage rights. In the 1970s and 80s, World Bank funded engineering projects replaced the traditional diversion structures, disrupting the flow rate and distribution of spate water.
The locations of these weirs in Wadi Zabid and diverted canals in Wadi Rima are illustrated in Fig. 1 – it can be seen that they are predominantly in the upstream areas, which are allocated 52% of the spate water, compared to 40% midstream and 8% downstream. Although in practise, no spate water reaches downstream areas. For the upstream farms, these structures provide adequate water to irrigate cash crops – pre-conflict incomes were reportedly 3 times higher – and increased power via control of the downstream flow – a position some farmers cemented by creating new diversion structures and dams.
This perpetuated existing inequalities in the wadis. World Bank data from 2000 shows that in Wadi Zabid only 18% of the cultivated area was farmed by the landowner, compared to 50% in Wadi Rima, with the burden of work falling on sharecroppers or tenants who receive one third of the output after taxes and maintenance levies. In Wadi Zabid 54% of farmland is privately owned by just 25 families, predominantly in the upstream area, who often also manage much of the remaining land owned by other family trusts.
The building of new diversion structures was compounded by weak governance – the Tihamah Development Authority had the formal responsibility but not the funds to operate and maintain these systems. The lack of maintenance led to the build-up of sediment and debris in some canals, preventing water retention and requiring farmers to create new diversion structures. Where operational, during periods of intense rainfall or high river-levels, upstream farmers tended to open the control sluices, releasing a flash-flood to the downstream areas.
The reduction in spate water reaching downstream areas led to an increase in the abstraction of groundwater. Although the diversion structures inadvertently block some subsurface flow, the shallow and easily rechargeable nature of the aquifers in the Tihamah means this abstraction may have been sustainable. However, at around the same time there was a widespread uptake of groundwater irrigation throughout Yemen. Across wadis Zabid and Rima more than 12,000 wells were drilled, and the area under cultivation expanded for cash crops. For example, the area growing bananas increased by a factor of 175. The pumping of groundwater was relatively cheap, as the Yemeni government heavily subsidised diesel to the tune of 25% of the national budget.
For the downstream areas in wadis Zabid and Rima, the uptake of groundwater irrigation has been problematic as the groundwater depth dropped by 30m between 1985 and 2005. In turn, this has led to saltwater intrusion into downstream areas, causing salinisation of the groundwater and soil, resulting in unproductive crops: 40% of date trees in Wadi Rima are unproductive because of salinisation. The Tihamah coast is one of the few places in the globe where there is now no freshwater discharge into the ocean – which is essential for mangroves and corals.
Conflict drivers of agricultural decline
It is clear that wadis Zabid and Rima were environmentally stressed before the current conflict, which led to many local conflicts over water access, although typically within rather than between each region of the stream. This reduced resilience and has likely played a role in leaving the region more exposed to conflict shocks.
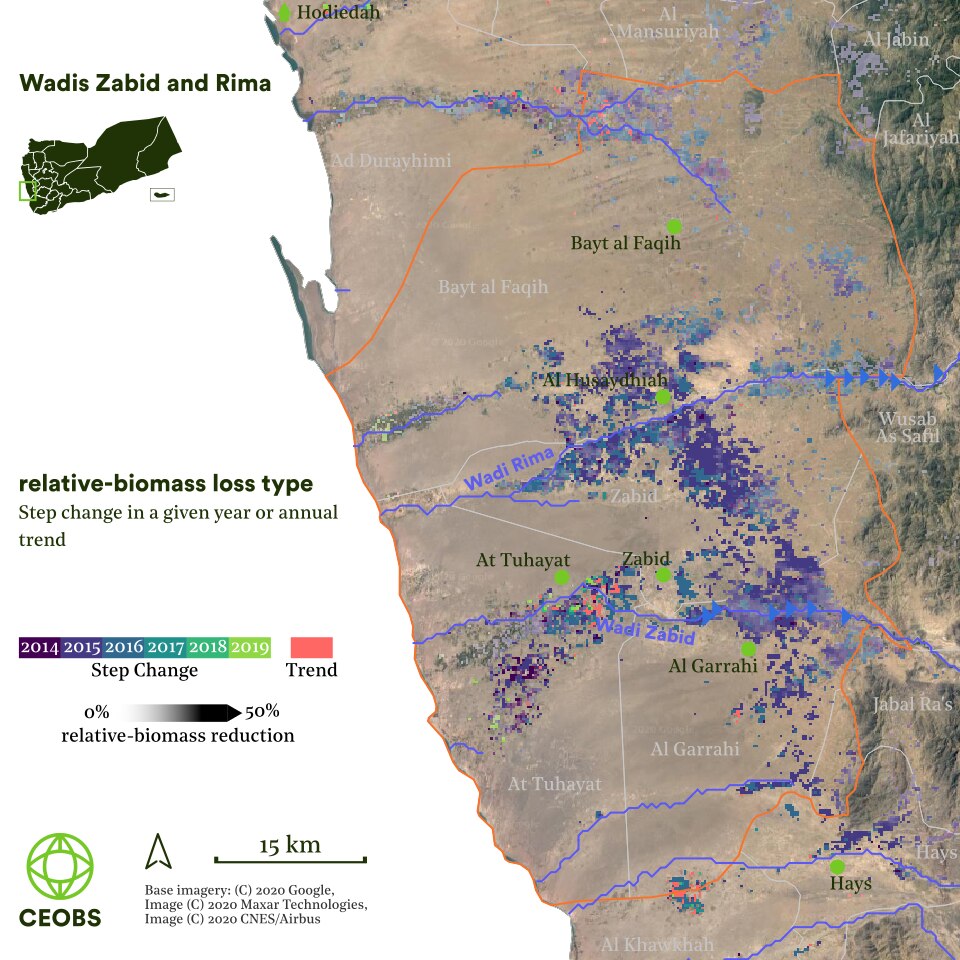
Figure 8. relative-biomass step changes.
Figure 8 shows how in wadis Rima and Zabid, most of the relative-biomass loss occurred as step changes in a particular year, rather than a long-term trend. In downstream areas the losses predominantly occurred in 2014, 2015 and 2019, and for the mid- and upstream areas, in 2015 and 2016.
These step changes indicate shocks rather than a continuous long-term decline. We have combined the timing of these step changes with a time series analysis of potential conflict drivers for the region in figure 6, which alongside local reports and testimony, will help elucidate the main cause of the agricultural distress.
1. Armed violence
Earlier assessments in 2017 and 2018 identified the intentional targeting of agricultural and water infrastructure in the Tihamah as part of a military strategy. Figure 6 shows instances of armed violence on water and agricultural infrastructure based on our analysis of the Armed Conflict Location and Event Data Project (ACLED) database. In total there have been more than 300 incidents affecting agricultural and water infrastructure in wadis Zabid and Rima.
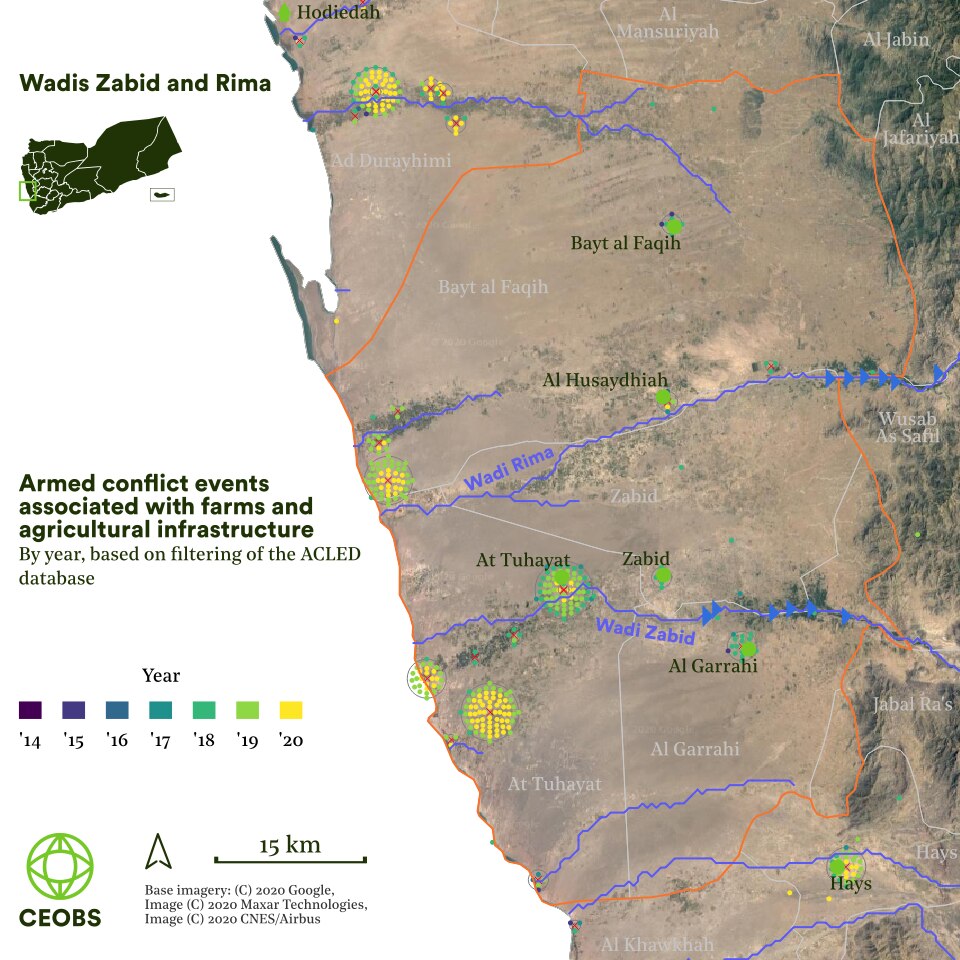
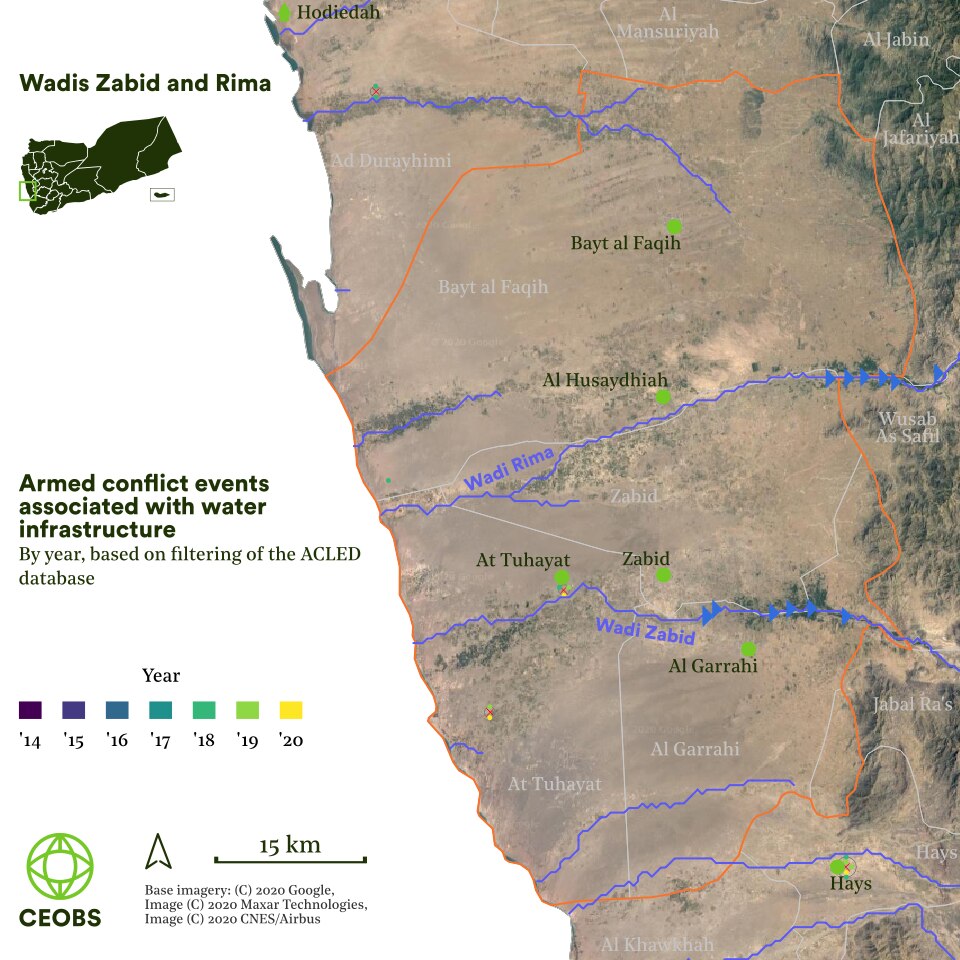
Figure 9. Location and year of incidents associated with agriculture based on analysis of the Armed Conflict Location & Event Data Project (ACLED) database. Data from 1st Jan 2015 – Jun 30th 2020.
There were, relative to the rest of the Tihamah, relatively few incidents in the early years of the war – just 13 in 2015, 2016 and 2017. However in the past two and a half years the number of incidents has increased significantly: in 2018 the majority of incidents were from air strikes and targeting by the Saudi-led coalition, whereas in the past 18 months the front line has entered the area and there has been ground combat between the conflict parties, with trenches being dug on some farms, such as near At Tuhayta.
“Saudi-led coalition airstrikes hit a farm in al Garrahi killing 15 civilians and injuring more”
Example agriculture or water related incident from the ACLED database, 14 Aug 2015 (1/7)
“Three air raids were launched by the Saudi-led coalition on a poultry farm in Al -Jabla area in Tahitia district of Hodeidah province. According to reports the farm was completely destroyed.”
Example agriculture or water related incident from the ACLED database, 08 Jul 2017 (2/7)
“The Saudi-led coalition reportedly carried out 40 air raids on Al Tuhayta Bayt al Faqiah and Ad Durayhimi district. No casualties were reported as the raids mostly struck farms.”
Example agriculture or water related incident from the ACLED database, 09 Jun 2018 (3/7)
“5 farmers were killed in an airstrike while getting water from a pump in Al-Jah in Bayt Al-Faqih. The water well a mosque and houses were damaged in the airstrike.”
Example agriculture or water related incident from the ACLED database, 10 Oct 2018 (4/7)
“Anti-Houthi forces including from the Saudi-led coalition reportedly fired more than 130 rockets on farms in Al-Fazzah coastal area in the south of Hodeidah governorate western Yemen with no report of casualties.”
Example agriculture or water related incident from the ACLED database, 19 Feb 2019 (5/7)
“On December 14 pro-Houthi forces reportedly shelled farmland near at-Tuhayta city in al-Hudaydah governorate with BMB vehicle shells and medium weapons causing damage to an irrigation system and destruction of farms. There were no reports on fatalities or injuries.”
Example agriculture or water related incident from the ACLED database, 14 Dec 2019 (6/7)
“On 19 June 2020 pro-Houthi forces reportedly fired ZU-23 cannon shells at civilian houses and farms in At Tuhayta district setting a farm on fire. No fatalities nor injuries reported.”
Example agriculture or water related incident from the ACLED database, 19 Jun 2020 (7/7)
These armed violence incidents do not coincide with the observed losses in total or relative biomass. As such it is tempting to conclude that armed violence has not been a contributing factor to the agricultural decline. However, there are three caveats. Firstly, all incidents will not be captured by the ACLED database, nor our filtering of it. This is especially true for the earlier years of the war, when the database was less sophisticated, and where more small-scale and localised impacts went unreported. For example, in comparison to data in the short period March 2015-August 2016 from MAI, the ACLED database (or our filtering) missed some agricultural incidents.
Furthermore, the 2017 FBLNF report stated
“the most notable agricultural damages for most households was the destruction of water structures as a direct impact of the war. Damages in water infrastructure included damages on water networks, diversion dams and irrigation systems… That has led to water shortage and unavailability for irrigation”.
The second caveat is the damage done to general community infrastructure that has indirectly impacted agriculture. According to the 2017 FBLNF study in Wadi Zabid, all respondents agreed that conflict-related damage to markets, commercial sites and transport was the most significant constraint on selling their produce. Up to July 2020, in total ACLED records 2,575 incidents of all types in wadis Zabid and Rima.
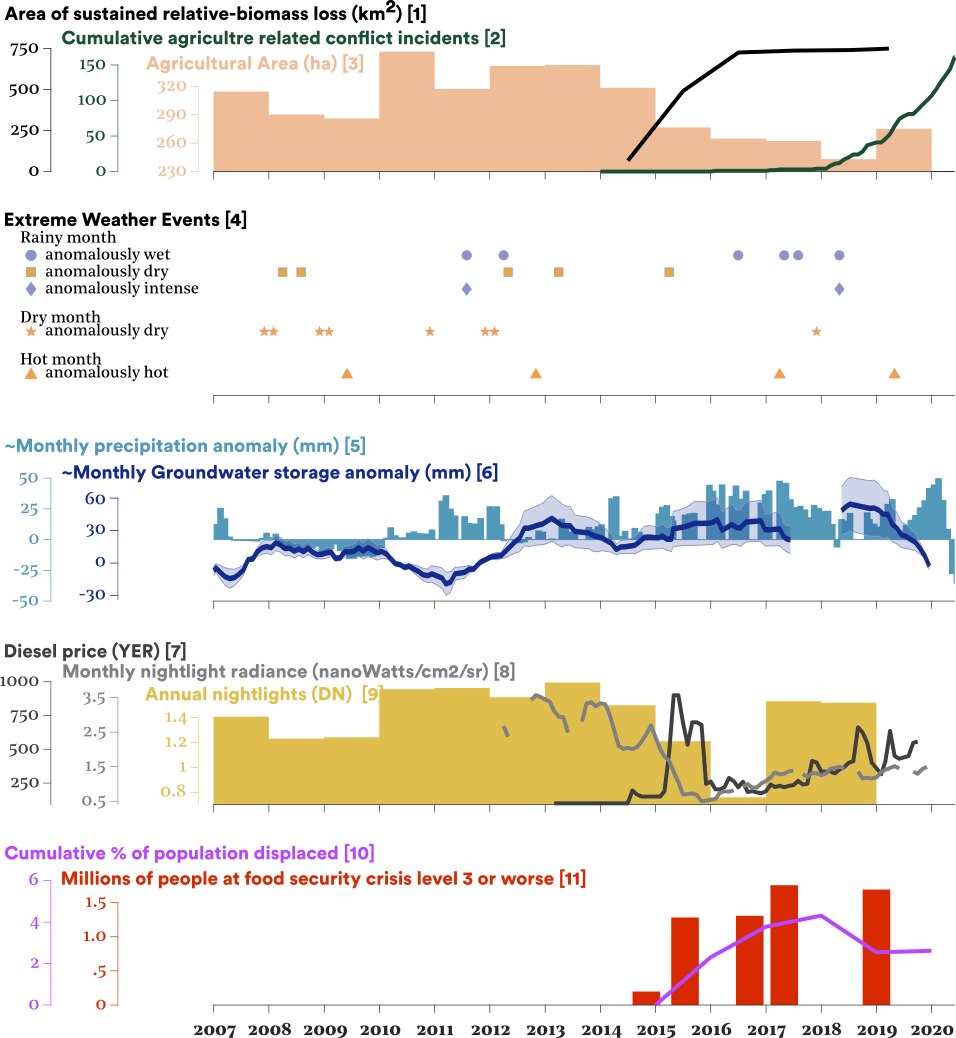
Figure 10. Time series of key metrics showing the complexity of the relationship between the environment, the conflict, and the economy.
[1] Based on summation of negative step changes in relative-biomass.
[2] Based on CEOBS identification of agriculture related events in the Armed Conflict Location & Event Data Project (ACLED) database.
[3] From Yemen Ministry of Agriculture statistics at governorate scale.
[4] Based on CHIRPS rainfall over the watershed for wadis Zabid and Rima, and land surface temperature data over cropland from the MODIS instrument, methodology in appendix.
[5] Based on of CHRIPS daily rainfall data.
[6] One year moving average groundwater storage anomaly average. Based on of GRACE liquid water equivalent and ESA CCI soil moisture data. Full methodology in upcoming CEOBS analysis of groundwater changes across Yemen. Error bars represent the data uncertainty propagated through the processing chain using Monte Carlo simulations where the error was correlated, and standard error propagation rules where not.
[7] From World Food Programme statistics.
[8] Based on of VIIRS night-time light data.
[9] Based on the harmonised DMSP and VIIRS annual night-time lights in Li et al., (2020).
[10] Based on ACLED conflict deaths and IOM Displacement Tracking Matrices and 2019 population estimates from IOM, UNFPA, OCHA, NAMCHA and CSO.
[11] Based on whole country IPC assessments at the governate level. Data for Hodiedah governorate.
2. Groundwater
Given how widespread irrigated cultivation is, and the particular dependency on groundwater in mid- and downstream areas, one potential driver is falling groundwater levels. However, Fig. 10 shows that since 2014 there has actually been a reversal of declining groundwater, with it rising to above normal levels and peaking in 2018 as the highest since the satellite data record began in 2002. In part this is due to the above average rainfall in recent years, and the porous geology of the groundwater basin, which allows for relatively quick recharge.
As with the rest of Yemen, the local well monitoring system has failed, so a longer historical comparison is not possible, nor a more detailed overview of the situation in particular parts of the wadis. This also prevents further understanding of the salinisation of groundwater – if it has become too brackish downstream, these areas may have abandoned abstraction, as has previously happened around the Al-Mujelis area.
3. Population dynamics
Given some of the pressures on farmers already identified, coupled to living in one of the active fronts of the conflict, it is no surprise that many of them have become internally displaced, or even casualties of the conflict. Our analysis of population changes showed that by the end of 2017 more than 4% of the population, nearly 40,000 people, had left wadis Zabid and Rima. This loss of labour contributed to the abandonment of many farms.
In 2018, the population increased as IDPs fleeing Hodeidah came to Zabid district, however there were still people leaving from elsewhere – in particular the downstream At Tuhayat district. Unfortunately, the country-level migration data does not cover 2019, but rapid assessments suggest that people continue to leave the area.
Rather than leaving the district, some farmers have searched for other livelihoods. In many instances, especially for young men, this involves joining armed groups and getting involved in the very conflict that has led them into such a dire situation.
4. Economic effects
The main cause of the agricultural distress in wadis Zabid and Rima is from the ‘economic war’, and in particular reduced access to agricultural inputs, especially diesel to pump groundwater.
A recent study surveyed farmers in Wadi Zabid and concluded that profit or loss was highly sensitive to groundwater depth. Areas downstream were particularly sensitive, and they are unprofitable for all crops once a groundwater depth of 75m was exceeded. The average depth of downstream groundwater wells in mid-2016 was 95m. The impact for farms upstream depends on their crops – those with fruit trees, and in particular bananas, were most susceptible to economic losses.
The modelling in this academic study assumed a fixed diesel cost but, as is clear from figure 7, there was a huge spike in the cost of diesel in 2015,4 following the loss of government subsidies and the blockade of ports. This dramatic change can also be seen by using satellite remote sensing – a significant drop in intensity of night time lights, a proxy for energy consumption, corresponds with the diesel price increase.
So, although the above average rainfall should have allowed for continued groundwater abstraction at a similar level, the economics made this very difficult for all but the richest landowners – and even then, with reduced irrigation hours. In Wadi Zabid the 2017 FBLNF report states that the cost of crop cultivation increased by an average of 29% from 2014 to 2015. In turn, the lack of groundwater led crops to fail, or yields to drop, particularly of mangos, bananas and tobacco in the upstream areas, and cereals, fodder and vegetables downstream.
However, the effects on farmers differed depending on their location in the wadis, and has likely exacerbated the pre-conflict tensions. The 2017 FBLNF report indicates that upstream areas increased their use of floodwater to counter the diesel price hike, although this was difficult due to the ill-maintained irrigation structures, and together this was at the expense of the downstream areas, where spate water availability was reduced.
These situations led to farmers’ incomes rapidly decreasing, further entrenching the poor food security situation. The high cost of fuel also led to an increased cost in transporting products to markets, whilst the economic war also reduced access to pesticides and fertilisers. The 2017 FBLNF report indicates that farmers’ net incomes decreased by more than 50% in 2016, compared to 2013 in Wadi Zabid. In turn, this led to a reduction in rent from land holdings of 50-60%.
As there has been some agricultural recovery in 2019, and solar panels have become more common, groundwater levels have begun to decline once again.
5. Extreme weather
The final driver to examine is extreme weather, which may not necessarily be captured when accounting for inter-annual variability with the relative-biomass product. Yemen’s capacity to deal with such events was limited even before the conflict, but the conflict-related collapse of governance will have reduced response capabilities further.
We have investigated the rainfall amount and intensity in the wadi watersheds to identify times when flooding was most likely.4 The most significant event was in May 2018 when rainfall was anomalously high and intense, while August 2017, May 2017 and July 2016 all experienced high rainfall totals. Contemporary satellite imagery shows the wadis with water flow but no evidence of damaging flooding can be seen, nor can mention be found in any of the studies referenced in this article, nor the wider press. This indicates that it is unlikely that widespread damaging flooding was important, although there may have been unreported localised problems, especially near sediment-blocked spate infrastructure.
Potentially more significant was the anomalously dry month of April 2015, in which just 477cm of rainfall fell across the region, compared to 1,591cm for the average April. This coincided with the internationalisation of the conflict, the hike in fuel price and our observed biomass losses.
A similar analysis for the extreme land surface temperature of the cropped areas reveals two instances of anomalously hot conditions during the conflict period, April 2017 and May 2019. During these times, the necessity for water will have increased and if inaccessible, it is likely crops were damaged. The heat alone may have been damaging or even fatal – many plants would struggle in the 52°C of May 2019 – although to our knowledge the exact temperature response of the typical crops is unstudied. High temperatures have however been responsible for significant post-harvest losses, as well as the loss of cold storage facilities, further hitting farm incomes.
In spite of the climate and extreme weather, wadis Zabid and Rima represent one of the few areas of the country not to be affected by locust outbreaks, nor fall armyworm.
Summary
Our investigations reveal significant agricultural losses in wadis Zabid and Rima. The region had little resilience prior to the current conflict, owing to unsustainable and inequitable water management practices. This led to a rapid decline in cultivation and yields when the economic impact of the conflict hit. In particular it appears that the lack of access to diesel for pumping groundwater was the final straw in many places. However, the cumulative impact of population loss, damage to essential infrastructure, loss of agricultural inputs and the collapse of management and maintenance bodies has also contributed. Together this has had a huge impact on livelihoods and by extension food security in the region, in particular for the 70% of the agricultural population who are tenants.
In the immediate future the outlook remains bleak; entrenched fighting in the area has led to increased levels of destruction, death and displacement. Furthermore, these security concerns have prevented the go-ahead of a large UN project looking to strengthen the role of women in water conflict resolution. Such activities may have helped to build resilience and move towards a more sustainable use of scant water resource. Such moves, and the inclusion of women, are needed in the longer term and water access needs to be central in peacebuilding activities, especially to address the climate stresses on groundwater recharge that are forecast for the area.
Longer term, new modes of water access may be necessary, including payment for ecosystem services between upper, middle and downstream areas, or from desalination along the coast using Yemen’s abundant renewable resources. Solutions such as coupling to more efficient drip feed irrigation techniques may be required if the pre-conflict trend of urban migration and loss of rural workers continues. The types of satellite and model data used in this article may also be helpful to optimise the conjunctive use of surface and groundwater through forecasting and modelling.
Appendix: Data and Methods
All data used in this CEOBS analysis is from open-source datasets. In most cases this data has been then been used to derive further data products using code developed in the Matlab, Google Earth Engine and QGIS programming environments. Where feasible, the data and code used here can be shared upon request. We are also happy to share our figures in higher resolution formats.
A1. Agricultural Distress Index
The data products used to calculate the distress index were:
- Total biomass produced annually, acquired from the FAO WAPOR platform on a 100m grid and referred to in this work as total-biomass. The product is calculated by aggregating the dekadal (every 10 days) net primary productivity. This is the carbon uptake owing to photosynthesis minus the losses by plant metabolism, calculated using solar radiation, weather, and Normalised Difference Vegetation Index (NDVI) derived products (land use type and therefore light use efficiency, fraction of photosynthetic radiation used and soil moisture stress).
- Gross Biomass Water Productivity (GBWP), also acquired from the FAO WAPOR platform on a 100m grid and referred to in this work as relative-biomass. GBWP is the ratio between annual evapotranspiration and total biomass produced. Evapotranspiration is the amount of water consumed by the plants through evaporation, transpiration and interception (i.e. rainfall). These terms themselves are a function of precipitation, temperature, humidity, soil moisture stress and land cover, all of which are accounted for based on data from earth observations, assumptions and model outputs. Large changes in relative-biomass over short time frames indicate a likely human driver, although effects arising from natural disasters will also be captured. Because GBWP is a highly derived product it is imperfect, and may not capture and assimilate all elements sufficiently – for instance it does not account for fog, which is a primary source of moisture for natural vegetation in Yemen’s coastal facing mountainous regions.
- The crop fraction for a given pixel, from Proba-V 2015 100m Land Cover maps. Where this was over 15%, a pixel was considered cropland. Qualitative validation of the product against visual imagery indicates a high success rate, although there are locations were classification is not perfect – particularly in the mountainous regions.
Any given pixel was deemed as distressed if any of the following conditions were met:
- The difference between the mean pre-conflict (2009-2013) total-biomass and mean post-conflict (2014-2019) total-biomass was greater than 2 standard deviations of the pre-conflict period (2009-2013), and the change was negative (i.e. loss of biomass).
- The difference between the mean pre-conflict (2009-2013) total-biomass and mean post-conflict (2014-2019) total-biomass when expressed as a percentage was greater than 50%, and the change was negative (i.e. loss of biomass).
- The difference between the mean pre-conflict (2009-2013) relative-biomass and mean post-conflict (2014-2019) relative-biomass was greater than 2 standard deviations of the pre-conflict period (2009-2013), and the change was negative (i.e. loss of biomass).
- The difference between the mean pre-conflict (2009-2013) relative-biomass and mean post-conflict (2014-2019) relative-biomass when expressed as a percentage was greater than 50%, and the change was negative (i.e. loss of biomass).
- The change in total-biomass was positive and the change in relative-biomass was negative, where the difference between the percentage changes was greater than 50%.
- The change in total-biomass was negative and the change in relative-biomass was positive, where the difference between the percentage changes was greater than 50%.
The statistics for each region were based on the following definitions:
- Southern Tihamah: Bounding Box: Lon 42.5->43.5, Lat 13->15, Elevation < 300m
- Jawf: Bounding Box: Lon 44.3->45, Lat 15.9->16.5
- Marib: Bounding Box: Lon 45.1->45.7, Lat 15.3->15.7
- Aden & Abayan Deltas: Bounding Box: Lon 44.6-> 45.7, Lat 12.7->13.4, Elevation < 300m
- Highland Plains: Bounding Box Lon 43.5 -> 45, Lat = 13.5->15.9, Elevation > 2000m, Slope < 2.5e6
- Upper Hadhramaut: Bounding Box Lon 47.8->49.2, Lat 15->16.4, Elevation < 750m, Slope < 2.5e6
Where the elevation and slope data was acquired from the Shuttle Radar Topography Mission (STRM) digital elevation model at 30m spatial resolution. Data processing was undertaken in Matlab and QGIS.
A2. Biomass step-change algorithm
Where there were negative changes in relative-biomass, we used a simple algorithm to determine if the change was the result of a step change or year-on-year trend, and if the former the year of the change-point.
To identify the locations experiencing a step drop in relative-biomass four numbers were calculated:
- relative-biomass mean for the period encompassing the year in question and the two proceeding years (one in the case of 2018, and none for 2019)
- relative-biomass mean for the period encompassing 2009 to the preceding year
- relative-biomass standard deviation for the period encompassing 2009 to the preceding year
- (b) minus two multiplied by (c), representing the size of change required for a step change
Where (a) was less than (d), and (d) was greater than a minimal change threshold of 0.15kg m-3, a negative step change was identified. The magnitude of this drop was then converted to a percentage by: ((a-b)/b)*100
For pixels where there was no step change, a trend was identified via least-squares if the Mann-Kendal test was passed with a 1% significance level.
A3. Filtering the ACLED database
The notes for each entry into the Armed Conflict Location & Event Data Project (ACLED) database for Yemen between Jan 2015 and Jun 2020 were filtered using keywords to find events associated with agriculture and water security. To avoid false positives, we also searched for exemptions, e.g. we identified entries with ‘field’ but then blacklisted these if the field is ‘oil field’, ‘field commander’, ‘field marshal’. The filtered entries have undergone some, but not exhaustive manual verification.
The keyword list for agriculture was:
‘ soil’; ‘ crop’; ‘agriculture’;’ farm’;’ fish ‘; ‘fisherman’; ‘fisheries’;’ bee ‘;’ beekeeper’;’ plants’; ‘ salt ‘;’ field’;’ agri’; ‘agro’; ‘vegetable’; ‘flower’; ‘plantation’; ‘onion’; ‘tomato’; ‘okra’; ‘legume’; ‘zucchini’; ‘mulukhiyah’; ‘ tree ‘;’ qat ‘; ‘ fruit ‘; ‘ coffee ‘; ‘palm’; ‘banana’; ‘mango’; ‘pomegranate’; ‘melon’; ‘cotton’; ‘orchard’; ‘garden’; ‘ arbor’; ‘ tractor ‘;’polytunnel ‘; ‘ nursery’; ‘greenhouse’; ‘dairy’;’ milk’; ‘livestock’;’ graze ‘; ‘grazing’;’ sheep ‘;’ goat ‘;’chicken’; ‘cattle’; ‘ cow ‘;’ cows ‘; ‘donkey’; ‘donkeys’; poultry’; ‘camel’; ‘horse’; ‘ruminant’; ‘forage ‘; ‘foraging ‘;’pasture’; ‘ herd’; ‘sorghum’; ‘millet’; ‘corn’; ‘cereal’; ‘barley’; ‘maize’; ‘sesame’.
And the exemption list:
‘seller’; ‘market’; ‘dealer’; ‘harbour’; ‘oil field’; ‘field leader’; ‘field commander’; ‘Raydan field’; ‘Yamani Dairy Factory’.
A4. Extreme Weather: Rainfall
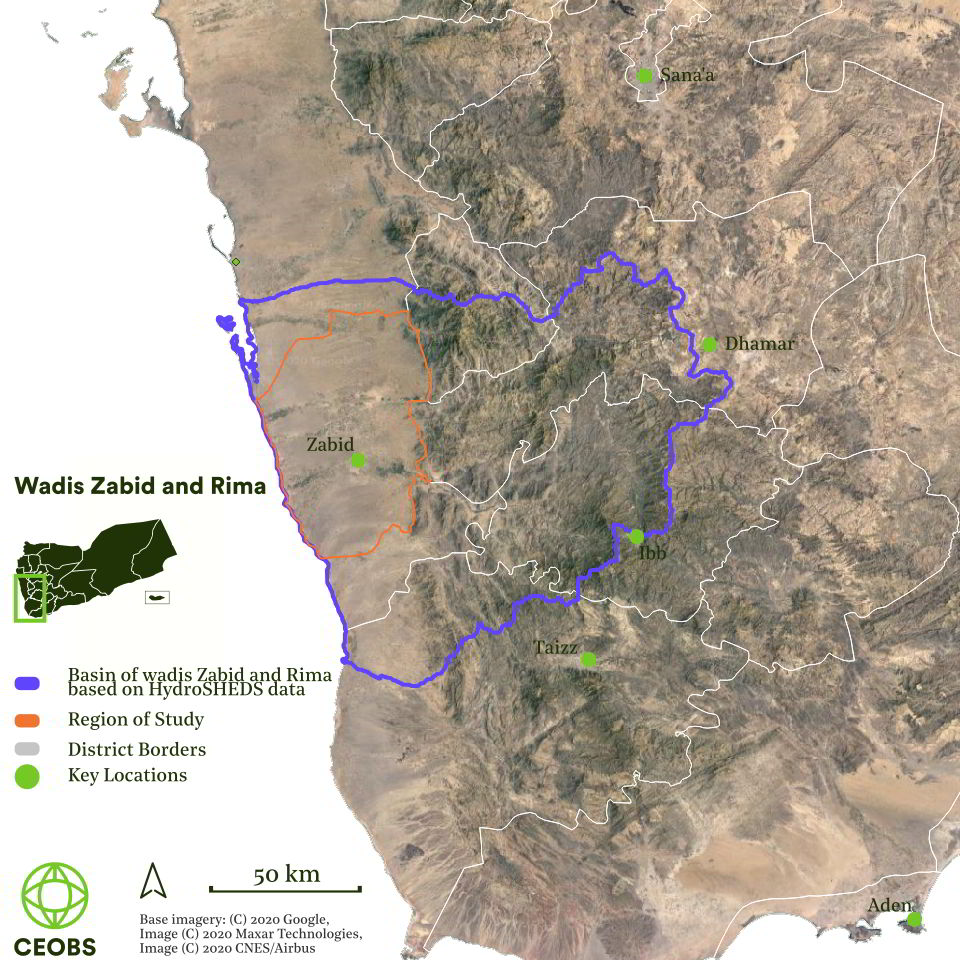
Our precipitation analysis uses precipitation estimates from the Climate Hazards Group InfraRed Precipitation with Station data (CHIRPS) dataset. This product combines satellite precipitation and cloud data with in-situ station data to create gridded rainfall time series, also accounting for biases introduced by complex terrain. Here, we used the daily 0.05° version of the data over 1981 to 2019 and investigated pixels within the entire basin of wadis Zabid and Rima (Fig. A1). This watershed was defined based on an analysis of the hydrological data and maps based on SHuttle Elevation Derivatives at multiple Scales (hydroSHEDS) project.
Rainfall intensity was calculated based on the definitions from the Expert Team on Climate Change Detection and Indices. Rainy and dry months were defined as the four months with the most and least rainfall based on a climatology assessment over the whole watershed for the 1981-2019 period. A month was defined as anomalously wet, dry or intense, if the value for a given month was more than one standard deviation greater than the climatology.
The blending algorithm used to produce the CHIRPS data does not include uncertainty information; this represents a substantial weakness of the product and means we cannot present uncertainties associated with the precipitation anomalies calculated. Apparently, work is ongoing to provide standard error fields, which may be available in future CHIRPS releases. In nearby Ethiopia, which has a somewhat similar climate, Dinku., et al (2018) found CHIRPS had high skill when compared to independent rainfall assessments.
It must be noted that the ground gauge data going into CHIRPS from Yemen ceased after the start of the conflict, although the coverage from surrounding countries remains good ensuring some level of ground constraint on the satellite measurements.
A5. Extreme Weather: Land Surface Temperature
To identify periods of extreme heat we used the MODIS land surface temperature product (MOD11A2.006), which has a 1km spatial resolution. Pixels were discarded where the quality assurance thresholds were not met and we only considered the temperature above cropland pixels (identified from the Proba V land cover map). The data was interpolated onto a monthly time-base and an anomalously hot month was defined when the temperature was over one standard deviation greater than the long-term mean (from 2000 to 2020).
- Instead of using the sun as a radiation source, as in multi-spectral imagery, the SAR instrument transmits a narrow band of microwave energy towards the Earth. This interacts with the surface, scattering away or back towards the satellite, where the strength of the return signal is measured. Different wavelengths of microwave energy are used to best characterise particular surface features. For the Tihamah we use ‘L-Band’ SAR, meaning it has a transmitting wavelength of 23.5cm and is particularly sensitive to trees as it matches the diameter of branches and trunks.
- This is when the main cropping cycle is approaching its December peak and also when the secondary growing cycle is at its peak. Note also that August is the month of maximum water flow through the wadis.
- We understand this natural vegetation is comprised of Acacia tortilis trees, invasive Mesquite Prosopis juliflora, plus Salavadora persica and Capparis decidua bushes. This assessment is based on surveys of a nearby area, which looks visually similar from satellite imagery, and the review of Yemeni vegetation in Scholte et al., 1991.
- ‘At crisis level or worse’ indicates an Integrated Food Security Phase Classification (IPC) score of 3 (crisis), 4 (emergency) or 5 (famine). The IPC is both a multi-partner network of governments, UN Agencies, NGOs, civil society and other relevant actors, and a standardised, science backed, classification and analytical approach.

