Earth observation for humanitarian disarmament
Published: August, 2021 · Categories: Publications, Environment in humanitarian disarmament
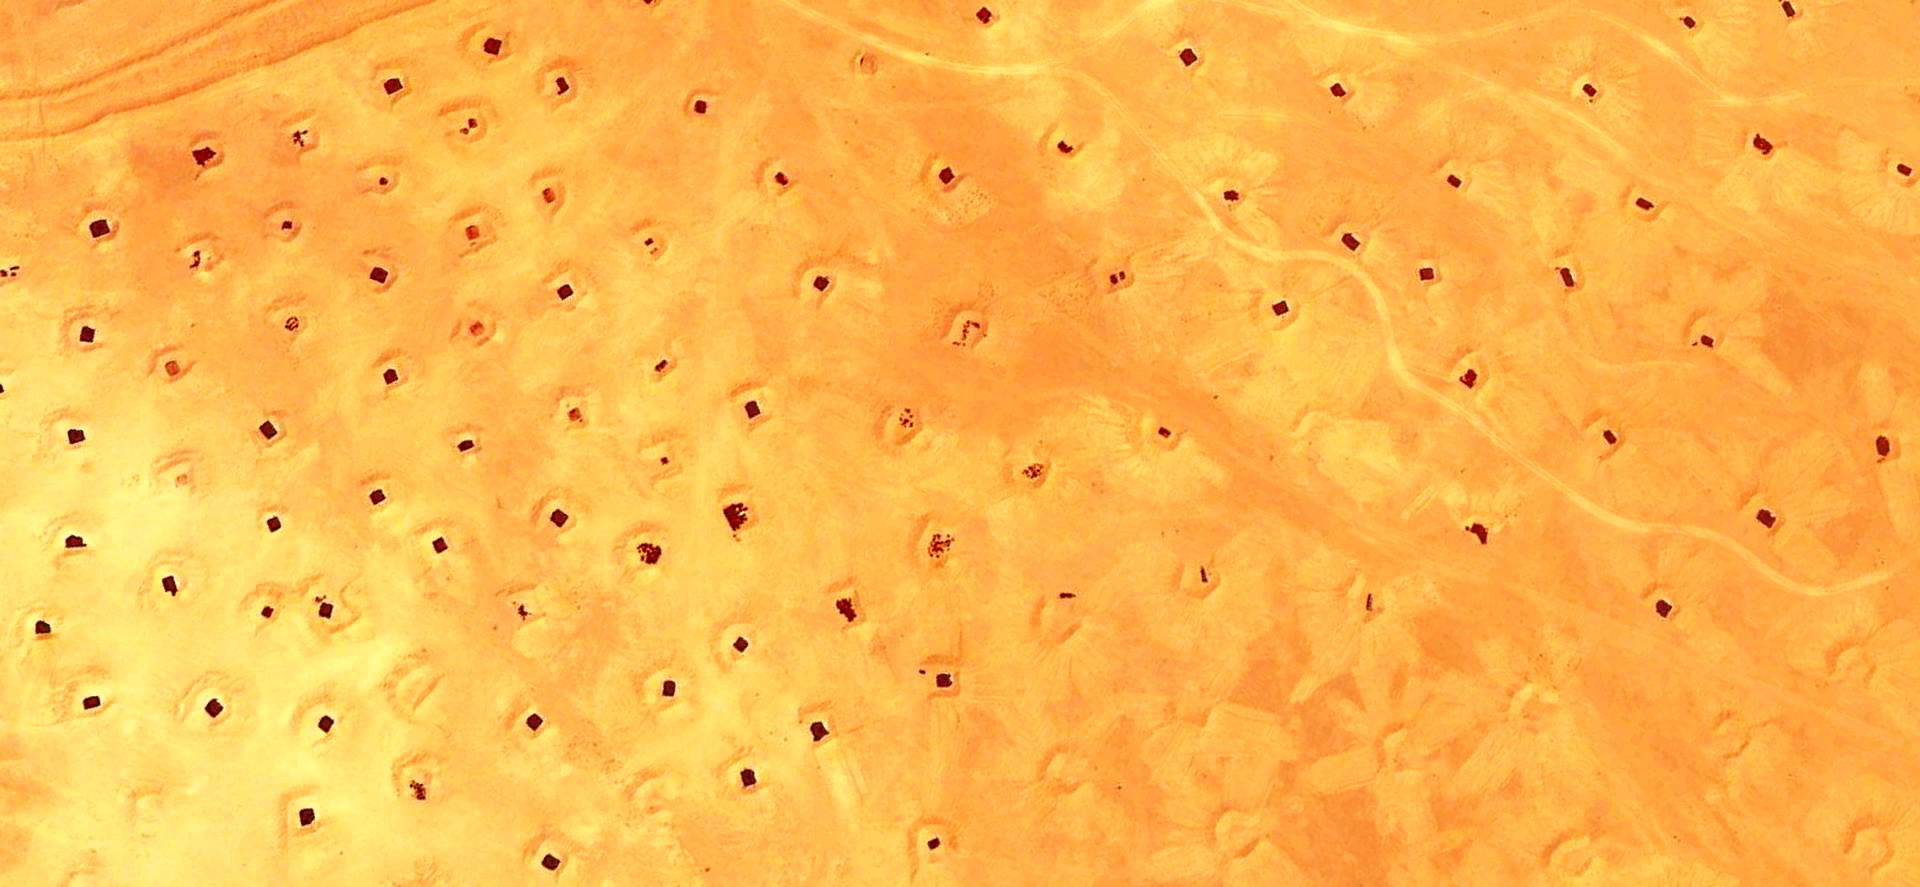
Large ammunition storage area in the middle of the Sahara desert, Libya. Image (C) 2021 Maxar Technologies, via Google Earth Pro. Imagery date 6th January 2004.
Overview
Earth observation via satellite remote sensing can provide invaluable insights for humanitarian disarmament programming.1 However, there remains an expertise and capacity gap in understanding what additional data is available or helpful, and how to process and apply the data. These challenges hinder the uptake of relevant geospatial insights by the humanitarian disarmament community – including allocating sufficient resources.
In this article we illustrate the potential of earth observations for humanitarian disarmament. We highlight where earth observations can be most useful, as well as the best datasets and methodologies to provide insight. In doing so, we build on an April 2021 webinar on the ‘Use of Remote Sensing and AI in the humanitarian disarmament sector’, which was hosted by the Geneva International Centre for Humanitarian Demining (GICHD) and the International Committee of the Red Cross (ICRC). The webinar demonstrated the appetite and need of the humanitarian disarmament community to engage with frontier technologies. We believe the use of earth observations can become as commonplace as Unmanned Aerial Vehicles (UAVs) across humanitarian disarmament programming.
Contents
1. Rural UXO Detection
The primary way new technologies are often sold to the humanitarian disarmament community is through promises of safer and more efficient detection of unexploded ordnance (UXO). This is not yet possible with the current generation of satellites due to the low level of detail on the ground at current resolutions. Currently, the best spatial resolution available – 30 cm – is too coarse to detect most anomalies caused by the presence of munitions. Intriguingly, current military capabilities show instruments with spatial resolutions of below 10 cm. If, in the distant future these are commercialised, application in UXO detection may be possible, especially in cohort with AI methodologies.
As this technology is not readily available, can earth observations currently be useful for UXO detection? Yes, at least partially. For example, through the identification of potential minefields through cratering and damage in rural landscapes. This remains a nascent field, enabled by recent advances in the availability of very high-resolution imagery, cloud computing and machine learning.
Historical satellite imagery might also provide vital clues as to the whereabouts of rural UXO. UXO can remain in-situ and hazardous for decades, preventing land from being utilised and contaminating soil as they corrode and munition components leak. One way to understand the areas that are at high risk, is to examine land-use changes over time – which are the areas communities are ignoring, or where use has drastically changed? Though imperfect, as communities may still use potentially hazardous land out of necessity, historical imagery can play a role in prioritising areas of concern. This would be in combination with information collected from community liaison and non-technical surveys.
But why bother with earth observations, given the successes of UAVs, which are more flexible, frequent, and offer a better spatial resolution? In many instances, earth observations will represent a safer, less invasive, and more cost-effective option that can cover larger geographic areas – and without requiring the specialist training for UAV use in the field. Further, where the security situation is fragile, there are import/export difficulties, or risk of UAV theft and military reuse, earth observations may offer the only safe insight – hence the development of new and robust methodologies remains important. In this context, it is worth considering the ways in which UAV and earth observation might be complementary in different conflict and post-conflict environments.
Case study: Cropland bomb craters in Cambodia
A recent seminal academic study, by Ohio State University, developed a new two-stage framework to identify bomb craters in agricultural land in Cambodia. The approach was essentially the same used by models which map meteor craters on the moon, but used an artificial intelligence algorithm adjusted to better represent craters on earth – i.e. eroded, covered in vegetation, and irregular in shape. The study was focused on a 100 km2 area near Kampong Trabaek, a town which was carpet bombed by the US Airforce. These bombing records have now been declassified and so by subtracting the number of craters identified, the authors could calculate the scale and location of the remaining UXO. It was found 44-50% of bombs remained unexploded. The overall accuracy rate of the method was found to be 89%.
Such an approach could be repeated across heavily contaminated areas elsewhere, and contribute to data collection for non-technical survey. Drawbacks to this approach are that it requires high level technical skill and costly commercial WorldView-2 satellite imagery. Although high-resolution imagery is now becoming more openly available – for example through the NICFI programme – the very high-resolution imagery needed for this crater analysis remains expensive.
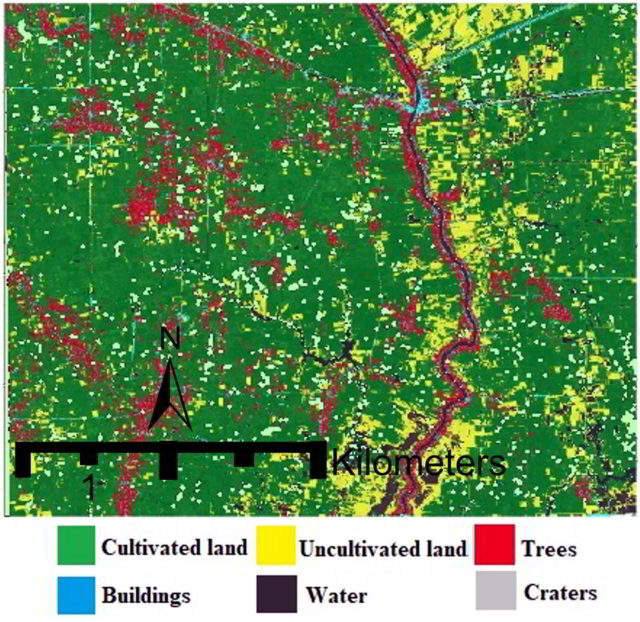
Figure 1. Crater detection in Cambodia based on satellite imagery. Source Lin E, Qin R, Edgerton J, Kong D (2020) PLoS ONE 15(3): e0229826. https://doi.org/10.1371/journal.pone.0229826. Figure remains unedited and is reproduced under terms of the CC BY 4.0 license.
2. Explosive weapons in populated areas and urban UXO
The use of explosive weapons in populated areas (EWIPA) is devastating for civilians, widespread, and poses operational difficulties for humanitarian disarmament. Most EWIPA use is in urban areas that have a high density of people and of key infrastructural assets. Local knowledge of the affected area can be lost as EWIPA use causes displacement. Nevertheless, people usually return relatively quickly, forced by economic circumstances, despite the direct UXO and indirect environmental health risks.
With reported detonation failure rates of between 10%-30%, developing mechanisms to monitor and verify EWIPA use is important to assess the ongoing risks from UXO, as well as the immediate human cost and damage. Altogether, this makes the UXO and clearance processes lengthy and resource-intensive, complicated by the presence of debris and hazardous materials. Earth observation data has the potential to provide support by:
- Damage assessments at regular and at ideally short time intervals, i.e. where and what was damaged when, and to what extent. These can be achieved with visual, multi-spectral, and radar imagery, at mixed moderate and high spatial resolutions, but requires coding expertise to run damage detection algorithms.
- Geographic Information Systems (GIS) which include useful data layers superimposed on damage assessments, e.g. locations of critical infrastructures. This can help map additional risks, e.g. pollution from damaged electrical substations. GIS mapping can also perform object-based detection, which can be useful for urban gridding and categorisation.
- High spatial resolution and multi-spectral imagery 2 combined with digital elevation models 3 and ground data to assess debris and rubble signatures, as has been achieved for earthquake damage.
- Understanding land use and wider environmental change following the use of EWIPA. In many cases, this could be achieved through expert visual analysis of high-resolution visual imagery. For larger events, other approaches may be possible – for example air quality assessments using TROPOMI data.
- Understanding the evolution of EWIPA events to estimate likely UXO locations, i.e. the order, timings, scale, and nature of ordnance used. Satellite imagery allows the construction of 3D building models – together with photographs/videos geolocated against satellite imagery, and weapons databases, very detailed timelines can be constructed – for example, analysis of the Beirut explosion by Forensic Architecture.
The Explosive Weapons Monitor, an in-development civil society research platform for EWIPA, might consider incorporating earth observation data on environmental impacts – we estimate that satellite data can help in quantifying six out of the 28 EWIPA indicators recently developed by the UN Institute for Disarmament Research (UNIDIR).4
Case studies: Space4Good and Urban UXO
Space4Good is a social enterprise born out of the European Space Agency Business Incubation Centre leveraging remote sensing data, geoinformation and artificial intelligence (AI) for social and environmental impact projects. Space4Good have worked to develop methods for the detection and monitoring of EWIPA, across two proof of principle studies in Libya (2019, with the HALO Trust), and in Syria (2020, with the Carter Centre). The objective in both studies has been to use satellite imagery to monitor and assess the damages done in the conflict zones, and to validate whether reported attacks had taken place. This is useful not only for understanding the impact of conflict, but also in using building damage as a proxy for detecting UXOs.
1. Damage assessments in Sirte, Libya, 2017
With the HALO Trust, Space4Good undertook damage assessments using low spatial resolution optical and radar imagery, as well as high spatial resolution panchromatic (black and white band) imagery. While the low-resolution methods provided promising but indeterminate results, panchromatic imagery produced more effective outputs for building damage detection. Using an optical time-series approach, whereby satellite images over time are compared, it was possible to detect the Battle of Sitre (2016). Then the high-resolution panchromatic image was used for damage detection in the neighbourhood level revealing the effects of the battle. (Figure 2).
Ultimately, due to the poor security situation on the ground, it was not possible to verify the damages identified from this study. However, it was concluded that lower resolution data is beneficial for detecting the timing of the event and a larger overview of damage to the conflict zone, while high-resolution data is better at detecting the level of damage to specific buildings and neighbourhoods.
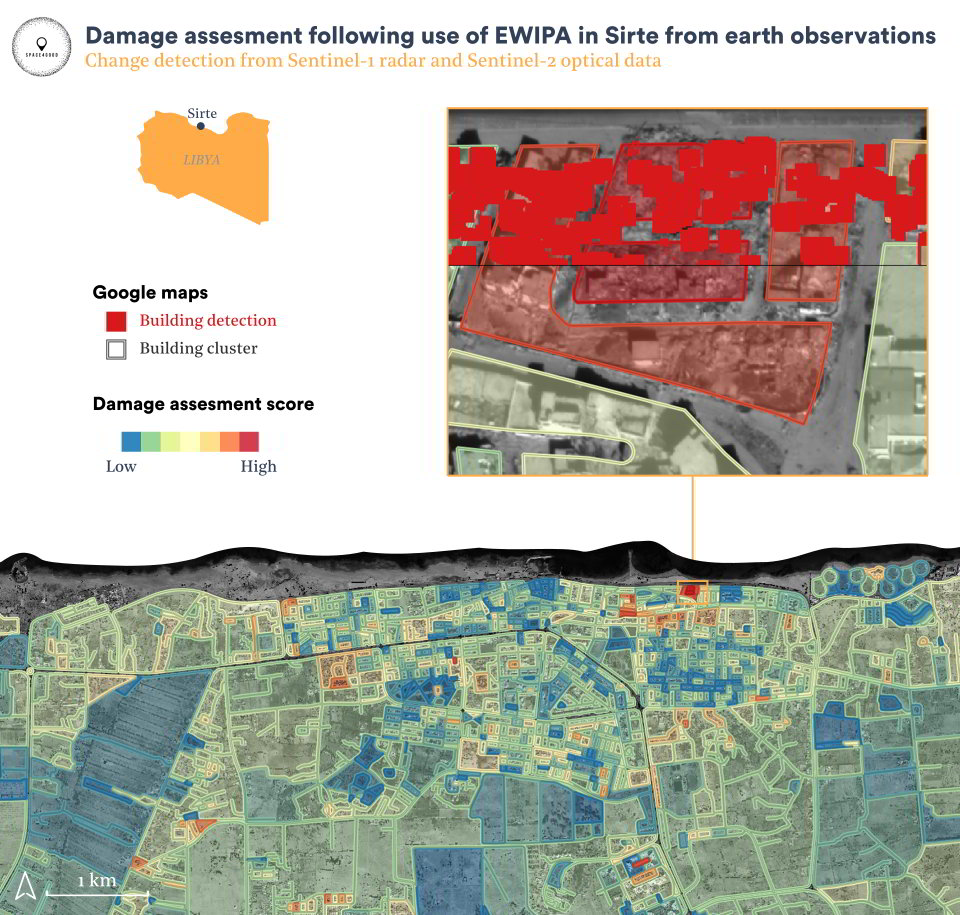
Figure 2. Damage detection in Sirte, Libya, using high resolution panchromatic imagery
2. Detecting explosive events in Syria, 2015-2020
Building on the methodology used in Sirte, Space4Good worked with the Carter Centre to detect explosive events over two districts in Syria. Two change detection methods were developed, one using optical imagery from the Sentinel-2 satellite, and the other using radar imagery from the Sentinel-1 satellite.
Optical change detection: Frequent imagery between 2015-2020 was used to detect patterns in reflection from Earth’s surface. After filtering out normal seasonal fluctuations and noise, artificial intelligence algorithms were able to detect small scale changes during and after explosive events. What was not possible, given the density of the 10 m pixels these satellites provide, was ensuring only changes arising from explosions were detected. There was, however, a strong correlation with changes to land use and the suspected explosions in both rural and urban areas using optical imagery.
Radar change detection: After pre-processing Sentinel-1 radar imagery, i.e. data cleaning and quality assurance, annual change maps were calculated for each year from 2015 to 2020. Figure 3 shows these areas of change as orange pixels on the radar imagery. If there was change detected in the radar imagery within 250 m of a known explosive event, then this change was assumed to be related to the explosion. Where the area of change was greater than 1 km2 – about four tennis courts – then the explosive event was considered significant. There were 75 such events between 2015 and 2016 (inset, Figure 3), 242 events between 2016 and 2017, and 25 events between 2018 and 2019.
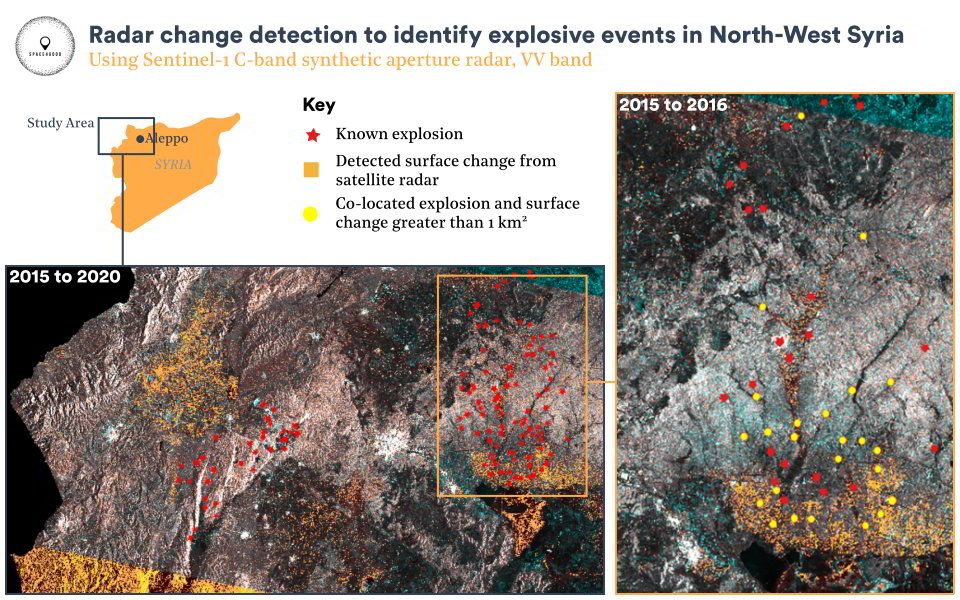
Figure 3. Change detection in North-West Syria using satellite radar data from Sentinel-1.
The exploratory nature of these two case studies was hugely important in providing a solid evidence base for future projects in this understudied field. Combining optical and radar methods or using free lower-resolution data alongside higher-resolution commercial data, for instance, could open a range of possibilities– enabling more accurate detection of damages of different sizes, and perhaps even classifying the types of munitions used in explosion incidents.
3. Operational planning tool
One of the most attractive possibilities of earth observation supporting humanitarian disarmament is in the use of the data to inform planning and risk assessments.
Although needs differ by geography and history, for day-to-day operations, earth observations can identify risks from:
- Precipitation, e.g. via meteorological satellites such as EUMETSAT, or via Early Warning eXplorer from USGS;
- Flooding, e.g via the University of Colorado Flood Observatory;
- Dust storms, e.g. via the meteorological satellites EUMETSAT, or the NASA worldview platform;
- Landscape fire, e.g. via the NASA FIRMS System, or the Global Wildfire Information System
- Air pollution, e.g. using data from the TROPOMI instrument, via a Google Earth Engine App;
- Changes to the built environment e.g. increased risk of building collapse.
For general operations, and planning to aid traditional surveys, earth observations can help assess:
- Operating conditions for humanitarian disarmament personnel, e.g. minimum and maximum temperatures and humidity, precipitation patterns can all be assessed with meteorological reanalysis products via platforms such as ClimateEngine
- Optimal timing for clearance for impacted civilians, e.g. for agricultural areas an understanding of crop phenology may be important;
- Difficulty of access, e.g. slope and elevation through Digital Elevation Models, or vegetation coverage and density;
- Environmental hazards with longer time-frames. These include those mentioned above operationally – precipitation, flooding, dust, fire and air pollution. Further hazards include land subsidence, changes in soil moisture, and changes in river levels.
- Baseline data for in-situ remote sensing using UAVs, e.g. geological information;
- New or unknown areas of UXO, e.g. via crater detection;
- Historical context – which may uncover unknown risks, especially in areas of displacement e.g. using declassified imagery (which can aid in the digitisation and georeferencing of old maps).
Such preparatory work can occur well before the security situation permits access to humanitarian disarmament organisations, laying the groundwork for more efficient and safer clearances when they can. Even when access is possible, the remote nature of earth observations can provide safety benefits. Drawbacks include the cost of very high-resolution imagery, up to thousands of pounds for single images, and availability in cloudy locations.
The greatest value from satellite data can be exerted when it is combined with local expert knowledge and ground data. This can help prioritise clearance areas – for example, a study by the United Nations University in Cambodia used such geospatial approaches to help locate social vulnerability hotspots.
Case study: NPA / CEOBS environmental assessment tool
An environmental assessment tool has been developed for mine action practitioners by Norwegian People’s Aid, a humanitarian disarmament and mine action NGO, and the Conflict and Environment Observatory (CEOBS). The aim of the tool is to identify how mine action operations may impact the environment, without the need for expert data processing skills.
The first step involves establishing the baseline state of the existing environment and setting by using open-source and local data on environmental conditions, which can include earth observation data. This will allow mine action operators to understand the environmental context of their activities and how mitigation measures can be followed to either reduce any adverse impacts or enhance positive outcomes. Part of the tool include use of Earth Map, an open-source resource which gives access to a wide range of climate and environmental data – including rainfall, temperature, elevation, slope gradients, vegetation cover, deforestation and changes in surface water occurrence – which can be used to build an understanding of the local and regional environmental conditions. Data on the location and type of fires for example (see Figure 4), can inform risk management and mitigation planning.
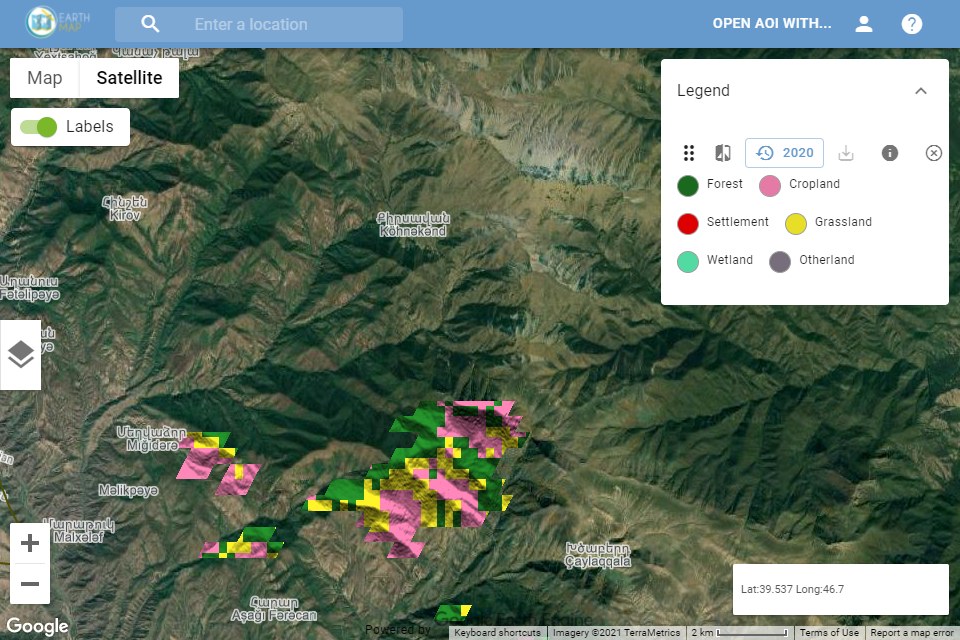
Figure 4. Screenshot of Earth Map data platform used in the NPA/CEOBS environmental assessment tool. Map displays the location and underlying land use type of burned areas in 2020, based on data from the MODIS satellite instrument, for an area in southern Nagorno-Karabakh – the disputed territory has significant contamination from UXO.
4. Documenting post-clearance land use
Where clearance has taken place in environmentally sensitive areas, such as the Skalingen peninsula in Denmark, or the Falkland Islands, earth observation data could be used to track the progress and ecological outcomes across the local area.
However, elsewhere there is surprisingly little data collected on the fate of land following mine clearance. Anecdotally there are reports of areas with a high carbon and biodiversity value being converted into agricultural monocultures but limited data or studies to back this up. Earth observations represent a fantastic way to begin to understand the existence and scale of this phenomenon, especially given the historical coverage of data – Landsat goes back to 1972 and in some locations declassified military imagery can push the data record back to 1960. However, the current missing piece to unlock the story of released land is good data from mine action authorities on which areas have been cleared and when.
Likewise, we do not currently understand the area of natural land not fully accessed and currently given protection by the ongoing presence of UXO. This could be globally significant in terms of carbon storage and biodiversity. Consideration of land release fate is codified in the IMAS standards and handing land back to communities in a way that ensures no loss of ecosystem services is important. Again, earth observation data offers us the capability to understand the scale of lands protected by UXO, and all kinds of indicators of their value, where local information on UXO contaminated areas is difficult to obtain.
Nonetheless, there is emerging research into the land release and fate relationship. For example, a recent study led by AidData researched the impact of humanitarian disarmament on development outcomes in Afghanistan. Part of the work included a land-use change assessment, classified using the catalogue of Landsat imagery at five-year intervals between 1995-2020. Following mine clearance after 2008, the study found a significant conversion of grassland, bare earth and forested lands to built-up areas. This suggests economic development on the land – a finding which was complemented by the increasing intensity of night-time lights, another earth observation dataset.
Through a PhD studentship, research will shortly start to understand the relationship between land release fate, land currently protected by UXO contamination, forest cover and carbon stores in Vietnam. The PhD will start in October 2021 at the Universities of Edinburgh and Leeds, with CEOBS as a case partner.
Characterising the roles and interlinkage of land change following development and demining will prove difficult. For example, figure 6 shows a heavily bombed area of Quảng Trị province in north-central Vietnam. Landsat imagery from 1975 shows the area covered in primary forest, but in 2020 is now agricultural – including forestry plantations. Could more environmentally sensitive practises following land release help ensure local livelihoods and the ecosystem services primary forests provide?
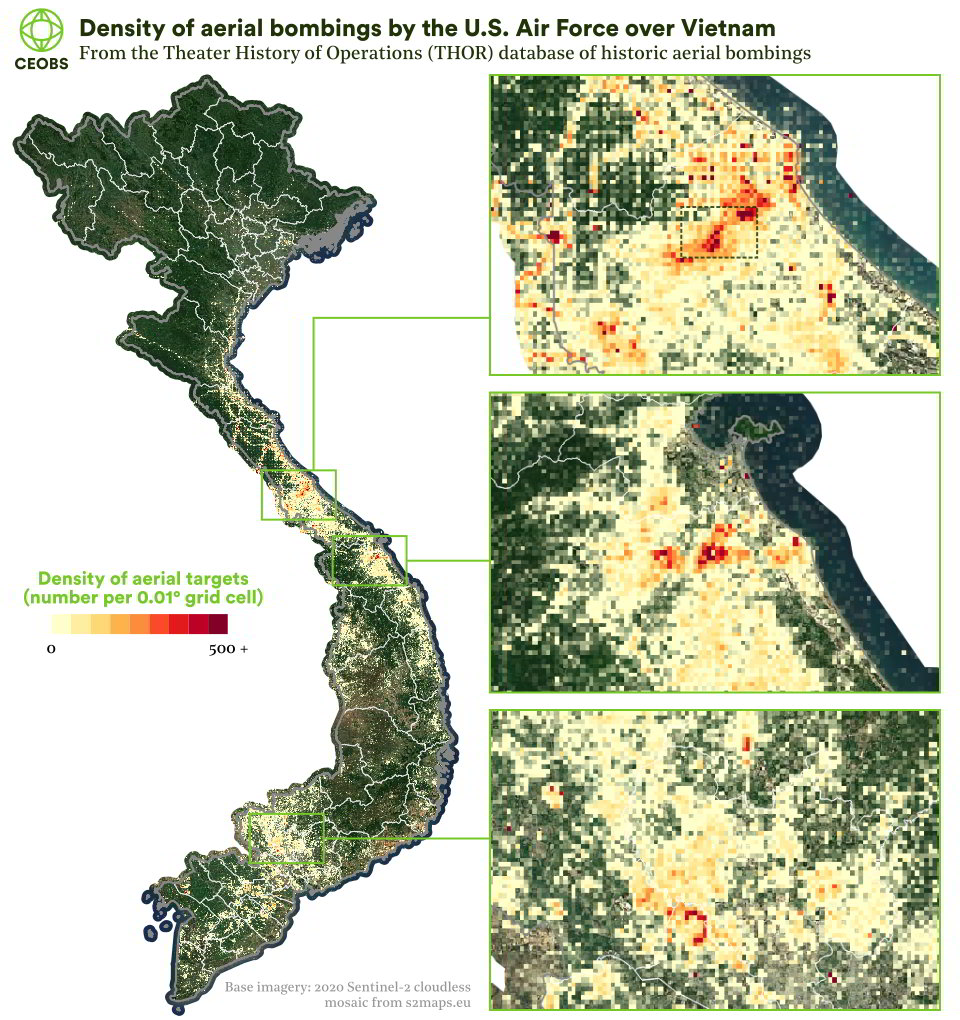
Figure 5. Density of aerial bombings over Vietnam. Data from the Theater History of Operations (THOR) database of historic aerial bombings in Vietnam by the U.S. Air force.
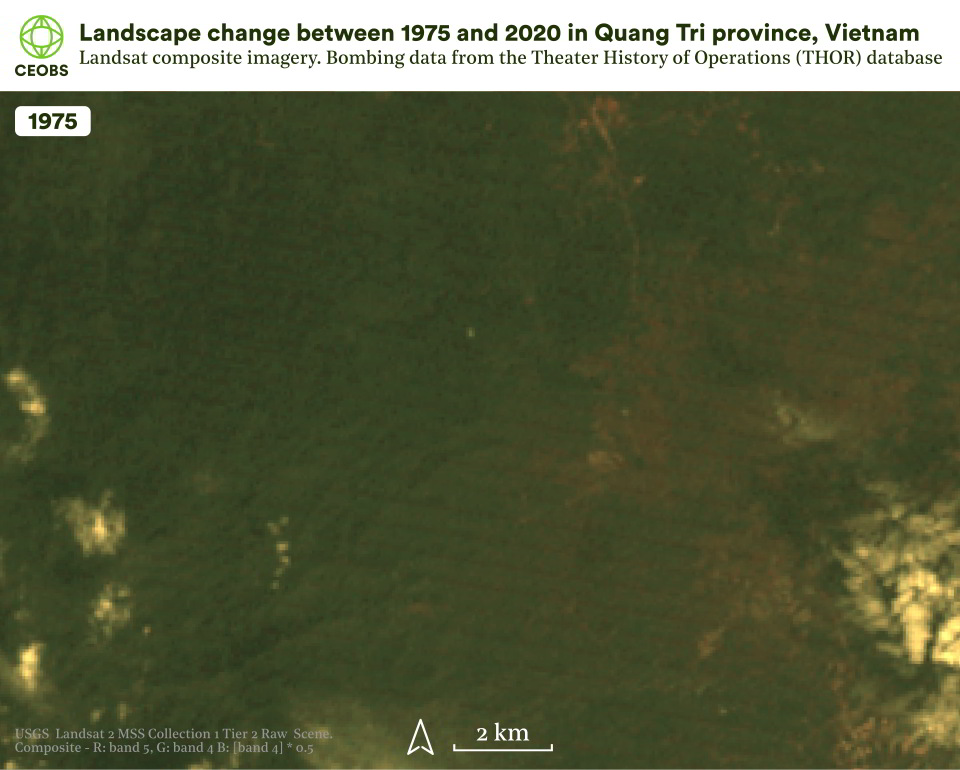
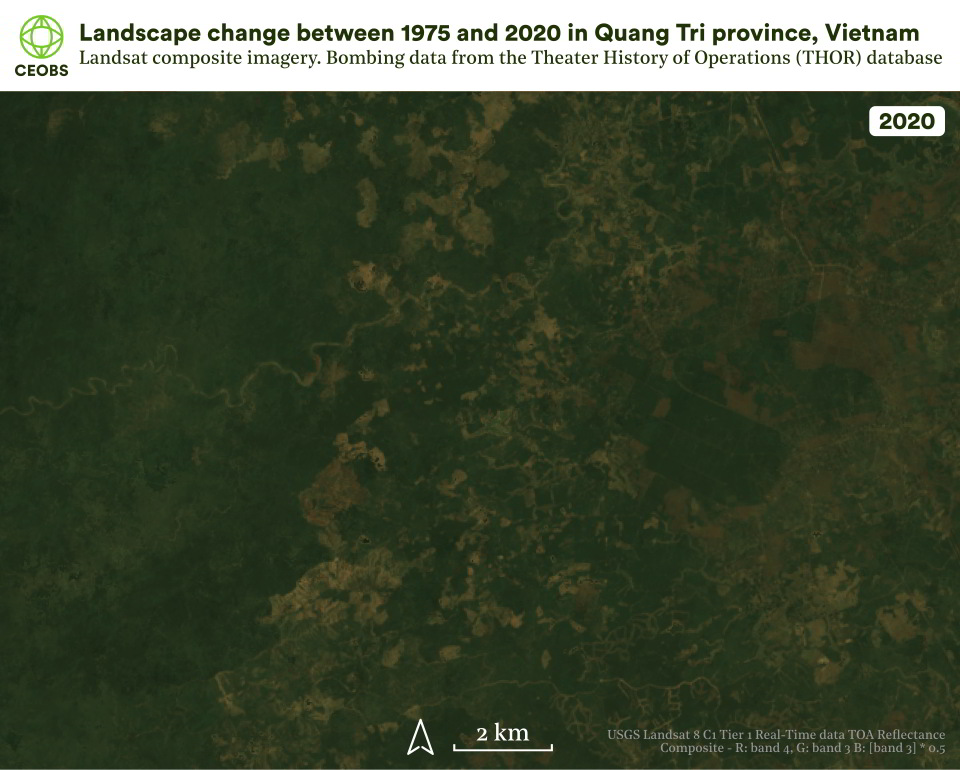
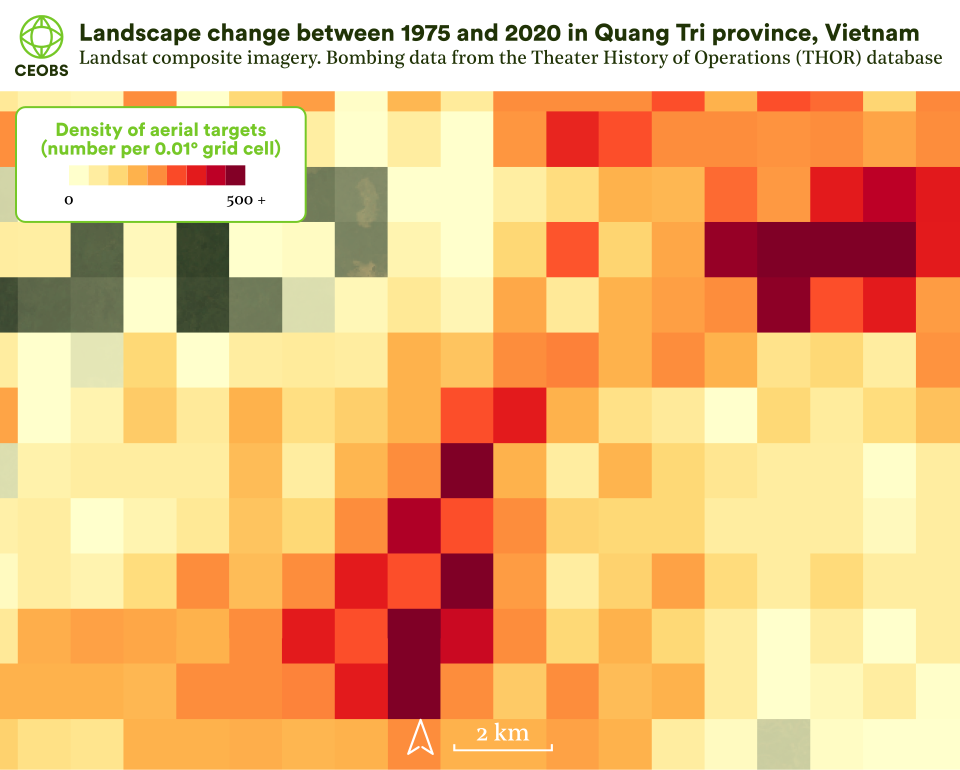
Figure 6. a) 1975 and b) 2020 near-infrared Landsat composite images of Quảng Trị, Vietnam. c) Density of aerial bombings in the same area. Location within Vietnam indicated by the green dashed-box in the top inset panel of Figure 5.
5. Climate risk and impacts
Earth observation data can be critical in understanding how environmental and climate change influence UXO risks and the response required from humanitarian disarmament. This applies to both terrestrial and marine UXO contamination.
The condition of UXO deteriorates over time, and more quickly under particular conditions. When corrosion occurs and the contents of UXO leak into the environment they can pose risks to the soil and water resources, relied upon by humans and nature alike. There are already worries for the Baltic’s marine environment from this “new” pollution source.
Many of the environmental conditions related to UXO deterioration are observable from space – for example, air, sea and surface temperature, soil moisture, surface water, sea and soil salinity. This information could be used as inputs to estimate the condition of UXO and highlight the most vulnerable locations – but to our knowledge, no such research has yet been undertaken.
Expected to increase as a result of climate change, floods and landslides can act to move UXO. Earth observation data through hydrological mapping or modelling, can be used to estimate possible new locations of transported UXO. Displacement of UXO by floods has been reported in Vietnam, Cambodia, Bosnia, Yemen, Iraq, Iran, and Pakistan, and has doubtless gone unreported elsewhere.
Case study: Laos dam collapse releasing UXO
In July 2018, the partly built Xe-Pian Xe-Namnoy hydropower Dam in Attapea province in Laos collapsed, following days of heavy rainfall from tropical storm Son-Tinh. This had a terrible immediate humanitarian toll but also risked longer-term effects, as the flood redistributed an unknown quantity of UXO. As part of the disaster response, the UNOSAT Rapid Mapping Service was deployed, using earth observation imagery and data to support the humanitarian response. One of the main initial tasks was to develop flood extent maps, achieved using Sentinel-1 radar data. As part of the post-disaster needs assessment, ground assessments were undertaken by humanitarian disarmament operators and combined with historic data to generate heat maps of the likelihood of the presence of UXO.
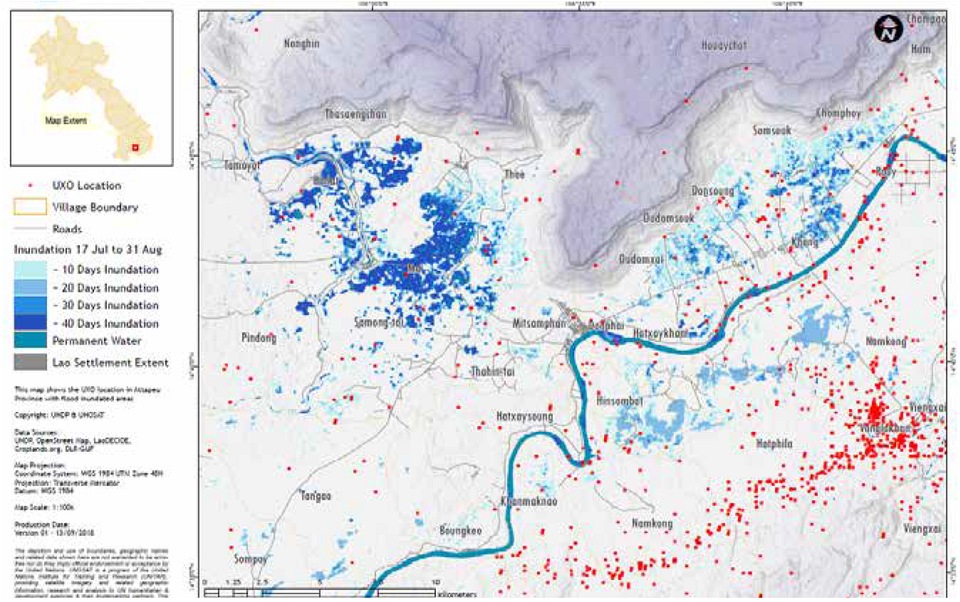
Figure 7. UXO risk from flooding following extreme weather and a dam collapse in Attapea province, Laos. Source UNDP/UNOSAT, LAO PDR Post-disaster needs assessment.
6. Close
There are diverse ways in which earth observations can support the humanitarian disarmament community. Closer collaboration between remote sensing specialists, the on-the-ground humanitarian disarmament experts, and policy makers will be crucial to any developments – such as that encouraged by the GICHD Mine Action Technology Workshops.
This kind of approach will help fill gaps in knowledge, ensure specific needs are best identified in different contexts, and lead to solutions applicable within national action plans. Previous feasibility studies led by the European Space Agency have not catalysed the widespread uptake of earth observations – hence more organic approaches may fare better. Ultimately, regardless of the appetite for earth observation usage, the funding challenges faced by both humanitarian disarmament and associated research efforts offers a serious barrier to uptake and innovation.
One approach to reduce costs and mainstream knowledge across the sector is through the adaptation of open-source geospatial products. Platforms like QGIS are free, yet on a par with proprietary software – having useful capabilities like plug-ins for near-real-time imagery or cloud computing (e.g. through Google Earth Engine). Furthermore, they have large and engaged user communities for support and knowledge transfer. It is likely that the greatest added value will arise if satellite data is mainstreamed throughout organisations and linked with geographic information systems (GIS), providing insights into survey, planning and land release.
This article was co-written by Eoghan Darbyshire and Linsey Cottrell (CEOBS); Elham Goumehei, Jonathan Walsh and Jessica Immelman (Space4Good), and Kendra Dupuy (NPA). Our organisations are keen on working together to further leverage earth observations for humanitarian disarmament, and we invite discussion from interested parties.
Space4Good is an innovative social enterprise utilising space technology for social and environmental good. Using remote sensing, GIS and artificial intelligence, we map, analyse and model complex ecosystems and support leading organisations and institutions on topics such as environmental crime detection, regenerative agriculture, tropical agroforestry management, humanitarian aid, air pollution and sustainable urban development. By doing so we help impact makers on the ground to make more informed decisions, improve the operational efficiency, create data-driven transparency and unlock new revenue sources such as carbon credits. We are a growing team of impact-driven entrepreneurs pushing the boundaries of geospatial innovation together with amazing partner multinationals, NGOs, universities and likeminded social startups like The World Bank, Rabobank, Arsari Enviro Industri, Red Cross and Ecosia.
- Humanitarian disarmament covers operations and advocacy which aim to reduce and prevent harm from the impacts of weapons and ammunition, and is driven by humanitarian and development needs.
- Most earth observation sensors are passive, meaning that they rely on the Sun’s energy to illuminate the Earth and the atmosphere, to then measure the return signal. This energy could be directly reflected at visible wavelengths, or absorbed and re-emitted as infrared, ultraviolet and microwave wavelengths. Different surface objects re-emit this energy at different wavelengths, therefore each one has its own spectral ‘fingerprint’. Sensors aim to capture this by measuring multiple wavelengths. This data can then be combined to produce informative images. Typically, these are true colour images – these emulate what the scene would look like to the naked eye, and are familiar to most through Google Maps and the like. So-called ‘false colour images’ are also produced – these use data from wavelengths outside the visible spectrum, and are used to highlight particular features that may be hidden to the naked eye.
- Digital Elevation Models (DEM’s) are maps of the Earth’s topographic surface and are typically derived from satellite measurements – synthetic aperture radar technology is used on instruments, such as the Shuttle Radar Topography Mission (SRTM).
- The relevant indicators are: Number or proportion of housing or shelter damaged or destroyed by explosive weapons; Number or proportion of cultural property damaged or destroyed by explosive weapons; Number or proportion of service plants and installations damaged or destroyed by explosive weapons; Proportion of transport network damaged or destroyed by explosive weapons; Number or proportion of health facilities damaged or destroyed by explosive weapons; Number or proportion of education facilities damaged or destroyed by explosive weapons.

