Satellite imagery can help assess the veracity of claims by the oil industry.
In this post Dr Eoghan Darbyshire uses satellite imagery to examine claims made by the Libyan National Oil Corporation than an offshore oil spill has been controlled. What he finds underscores the importance of independent scrutiny of the oil industry in insecure and conflict settings.
Accidents will happen
On the 8th October, the Libyan National Oil Corporation (NOC) alerted the world to an offshore oil spill. The spill had occurred around the Farwah floating production storage and offloading (FPSO) platform, during the offloading process onto a tanker. Farwah FPSO is moored 86 km offshore the Libyan-Tunisian border.
However, the press release was not delivering bad news. Instead it was full of celebration and congratulations – a response team had been scrambled, and they were able to control and treat the spill. NOC chairman Eng. Mustafa Sanalla, acknowledged that “accidents are expected to occur” [translation] but praised the speedy response and teamwork of the Total and Eni oil companies, Oil Spill Response Limited, the NOC, the Mabrouk Oil Operations Company, and the Mellitah Oil and Gas Company.
The press release reassured readers that the oil slick was controlled and treated, meaning it would not have a negative impact on Libya’s beaches. However, our analysis of satellite imagery suggests this may not be the case. What appears to be oil can be observed near and down current of the Farwah FSPO. These slicks appear to be tracking towards the beaches between Zuwara and Sabratah on the Libyan coast – in the meantime already impacting the marine environment.
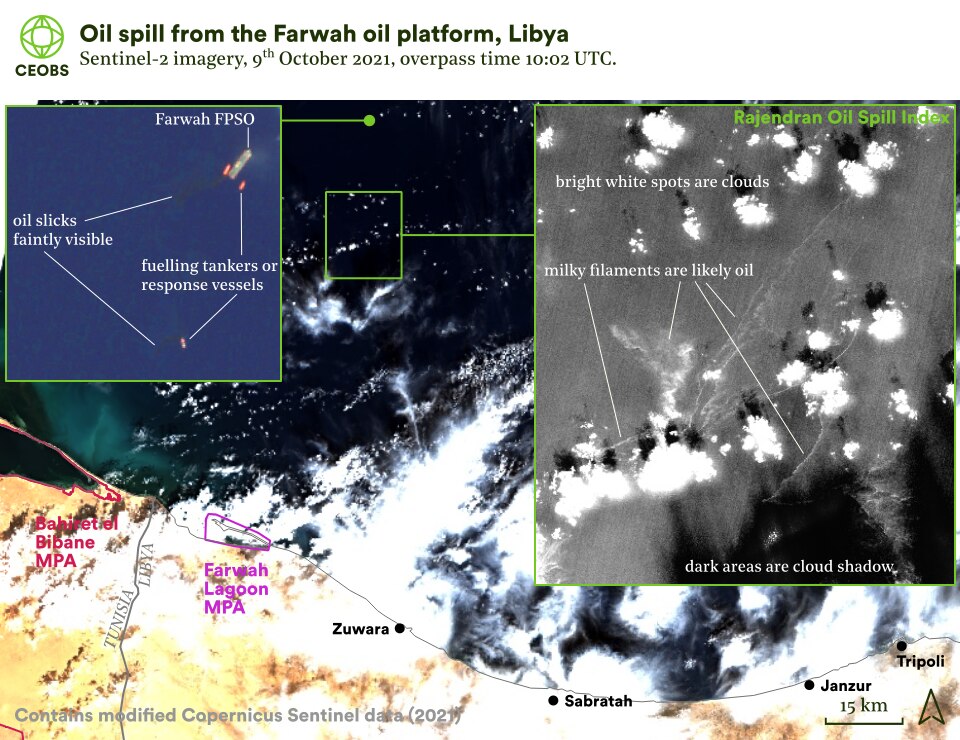
Figure 1. Likely oil spills emanating from the Farwah FPSO on the 9th October 2021. Oil spill index authored by Sankaran Rajendran. Outline for the Farwah lagoon marine protected area (MPA) from the IUCN, and for the Bahiret el Bibane MPA from Protected Planet.1. The true colour imagery can be found at this link, and oil spill index at this link. Use the slider to alternate the inset imagery between true colour and oil index imagery.
The first imagery is from the 9th October, the day after the incident was reported, from the Sentinel-2 satellite (Figure 1). This shows a slick stretching 6 km south-west from the FPSO. Around 10 km south of this slick is an area where there are many filament structures that are also likely to be oil, the maximum of which is 15 km long. These presumably originate from the FPSO given the south-south-easterly direction of ocean currents during this period.
These potential oil slicks are not easily visible in the true colour imagery – i.e. what it would look like if we were looking from space – but can be seen by using the satellite data to generate an oil spill index. This index is based on combining the wavelengths measured by Sentinel-2 that best capture the absorption by oil.
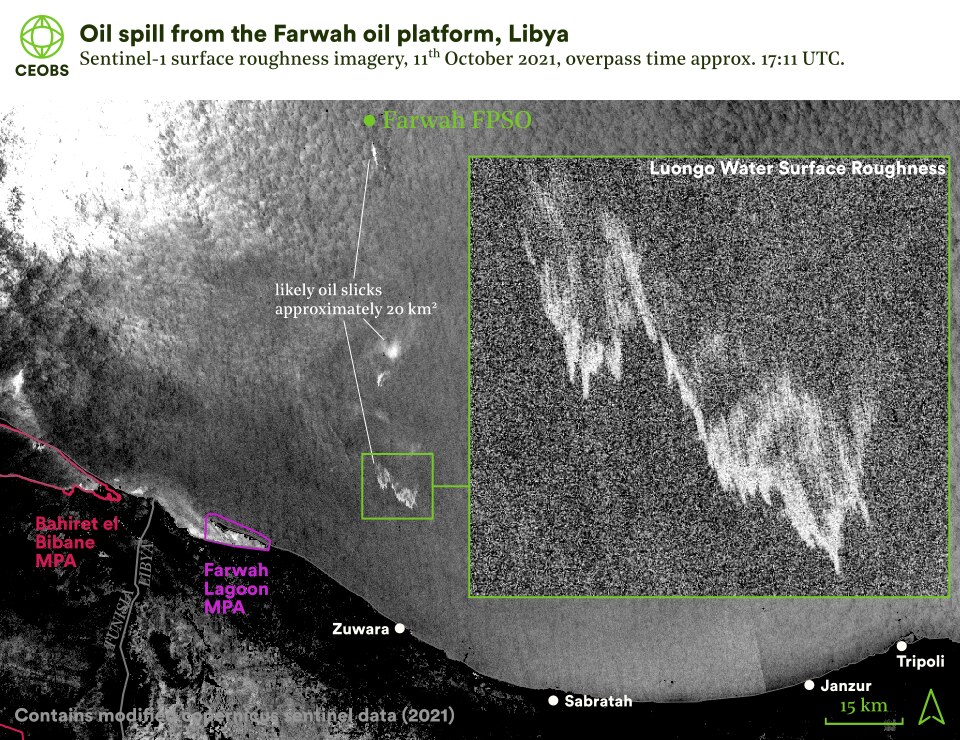
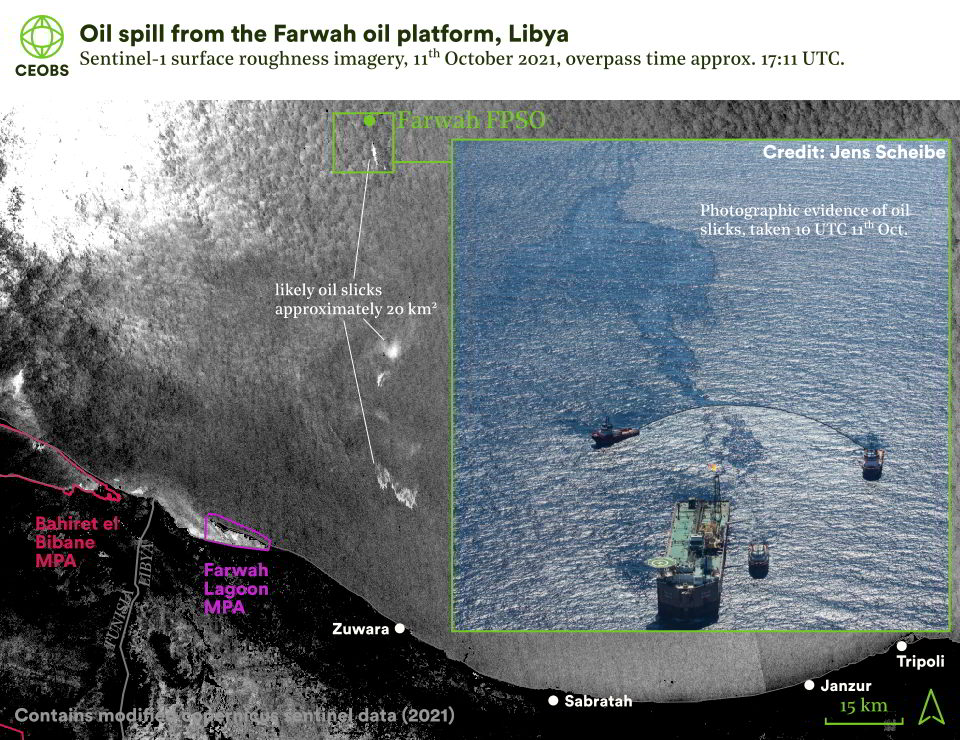
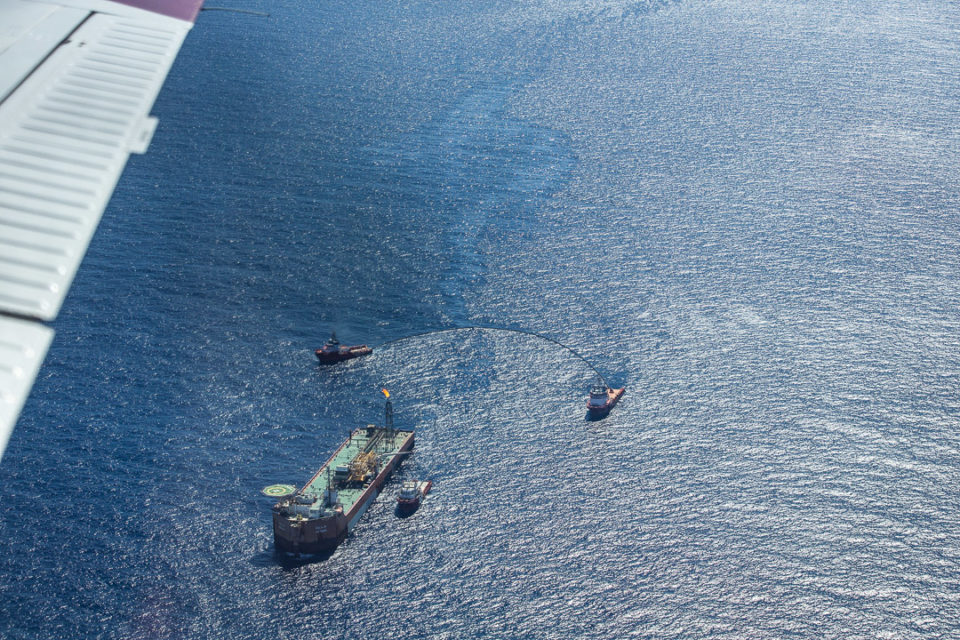
Figure 2. Oil spills emanating from the Farwah FPSO on 11th October 2021. The water surface roughness imagery can be found at this link. Photography credit: Jens Scheibe. Water surface roughness index authored by Annamaria Luongo. Sentinel-1 data acquired from the EO Browser, https://apps.sentinel-hub.com/eo-browser/, Sinergise Ltd. Oil spill index authored by Sankaran Rajendran. Outline for the Farwah lagoon marine protected area (MPA) from the IUCN, and for the Bahiret el Bibane MPA from Protected Planet. Use the slider to alternate the inset imagery between photography and water surface roughness.
The area affected by the spill may be even larger, but thick cloud cover and cloud shadows prevent the Sentinel-2 satellite from measuring this. Cloudiness has been a problem in the days since the spill, and this makes tracking the movement and spread difficult. Fortunately, on the 11th and 12th October, there was an overpass by the Sentinel-1 satellite – this uses radar observations that can ‘see through’ clouds and to the ocean below. Furthermore, the data can again be processed in a way that shows the likely presence of oil – this parameter is called water surface roughness.
The Sentinel-1 radar imagery indicates approximately 20 km2 of likely oil slicks to the south of the Farwah FPSO on the 11th October (Figure 2). The following day (Figure 3) the oil slicks persisted and travelled further south-east towards the Libyan coast. At the time of writing on 13th October, the spill has travelled a further 20 km south-east and at this rate will reach the coastline tomorrow. Any clean-up operations required may be made problematic by the stormy weather expected in the coming days.
Libya has some of the most pristine coastline in the Mediterranean, however tar balls from oil spills and discharges from tankers are common. The Libyan coast is particularly important for its population of nesting turtles, seagrass beds and colonies of rare seabirds.
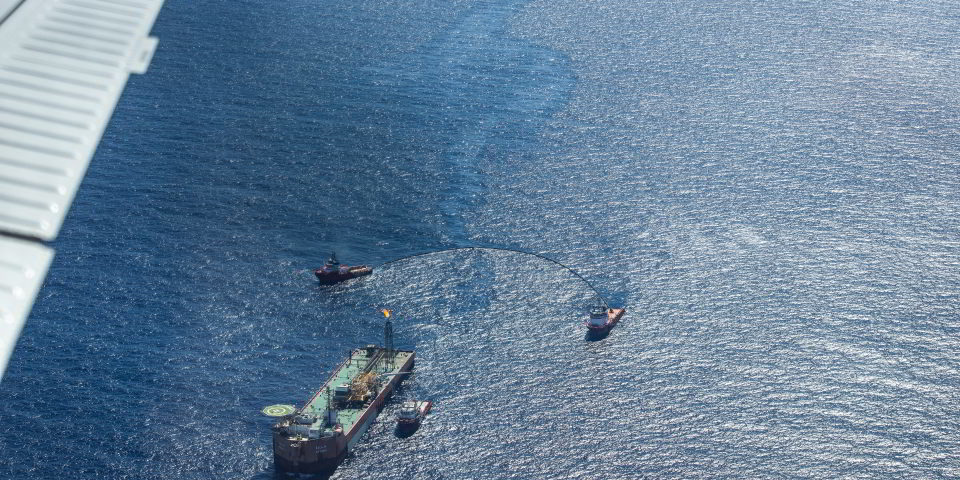
Update 2nd November 2021: We have kindly been provided photography from a light aircraft in the vicinity of the Farwah FPSO on 11th October at approximately 10 UTC. These images, showing oil beyond the response vessels four days after the incident, seem to confirm the satellite images and thus strengthen our conclusion that the response wasn’t quite as successful as the NOC press release indicated. Our thanks to the photographer Jens Scheibe for passing the photos along and allowing us to reproduce them here. We have found no reports on the impact of the oil along the coastline near Sabratha.
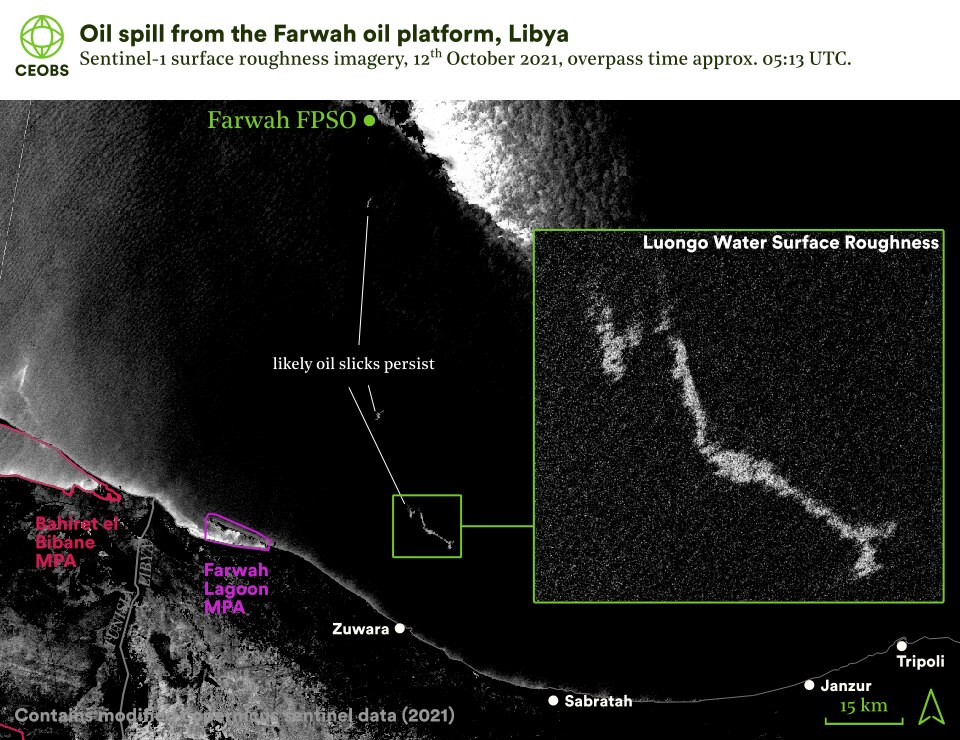
Figure 3. Likely oil spills emanating from the Farwah FPSO on 12th October 2021. The water surface roughness imagery can be found at this link. Water surface roughness index authored by Annamaria Luongo. Sentinel-1 data acquired from the EO Browser, https://apps.sentinel-hub.com/eo-browser/, Sinergise Ltd. Oil spill index authored by Sankaran Rajendran. Outline for the Farwah lagoon marine protected area (MPA) from the IUCN, and for the Bahiret el Bibane MPA from Protected Planet.
Causes and concerns
The Farwah FPSO platform can hold 900,000 barrels of oil and has been in service for nearly 20 years. Unlike other oil infrastructure in Libya, the offshore Al Jurf field only had a short interruption owing to the conflict and has continued to pump crude. Video footage appears to show the routine offloading of oil in the weeks before this incident.
Oil spills are not unusual in conflict areas.2 What is unusual in this case is that production from the offshore oil field has continued largely uninterrupted during the conflict, maintenance has been carried out, and swift action was apparently taken when the spill happened. Nevertheless, the satellite imagery indicates that the spill was not fully contained, despite assurances in the NOC press release. The example poses questions of transparency and accountability for the NOC, and for the oil companies operating the facilities.
There are questions too for the rigour of Libya’s media. We have found no evidence of any investigations into the validity of the press release – instead it has simply been recounted in local media, and a brief description given by international press agencies. Accompanying some of the media reporting, for example Ai-Ain, is an image that appears to show the oil spill being cleaned up – but these images actually originate from a training exercise four years earlier.
While it seems unreasonable to expect local media outlets in Libya to have the capacity to access and analyse satellite imagery of Libyan oil operations, there is clearly a lesson here that they shouldn’t necessarily take the claims of the NOC and other operators at face value.
Although “accidents are expected to occur”, they will happen with more frequency and greater severity in the absence of effective scrutiny.
Eoghan Darbyshire is CEOBS’ Researcher.
- UNEP-WCMC and IUCN (2021), Protected Planet: The World Database on Protected Areas (WDPA) and World Database on Other Effective Area-based Conservation Measures (WD-OECM) [Online], October 2021, Cambridge, UK: UNEP-WCMC and IUCN. Available at: www.protectedplanet.net
- Oil spills occur with alarming frequency in Libya, Yemen, Syria, Iraq and South Sudan

