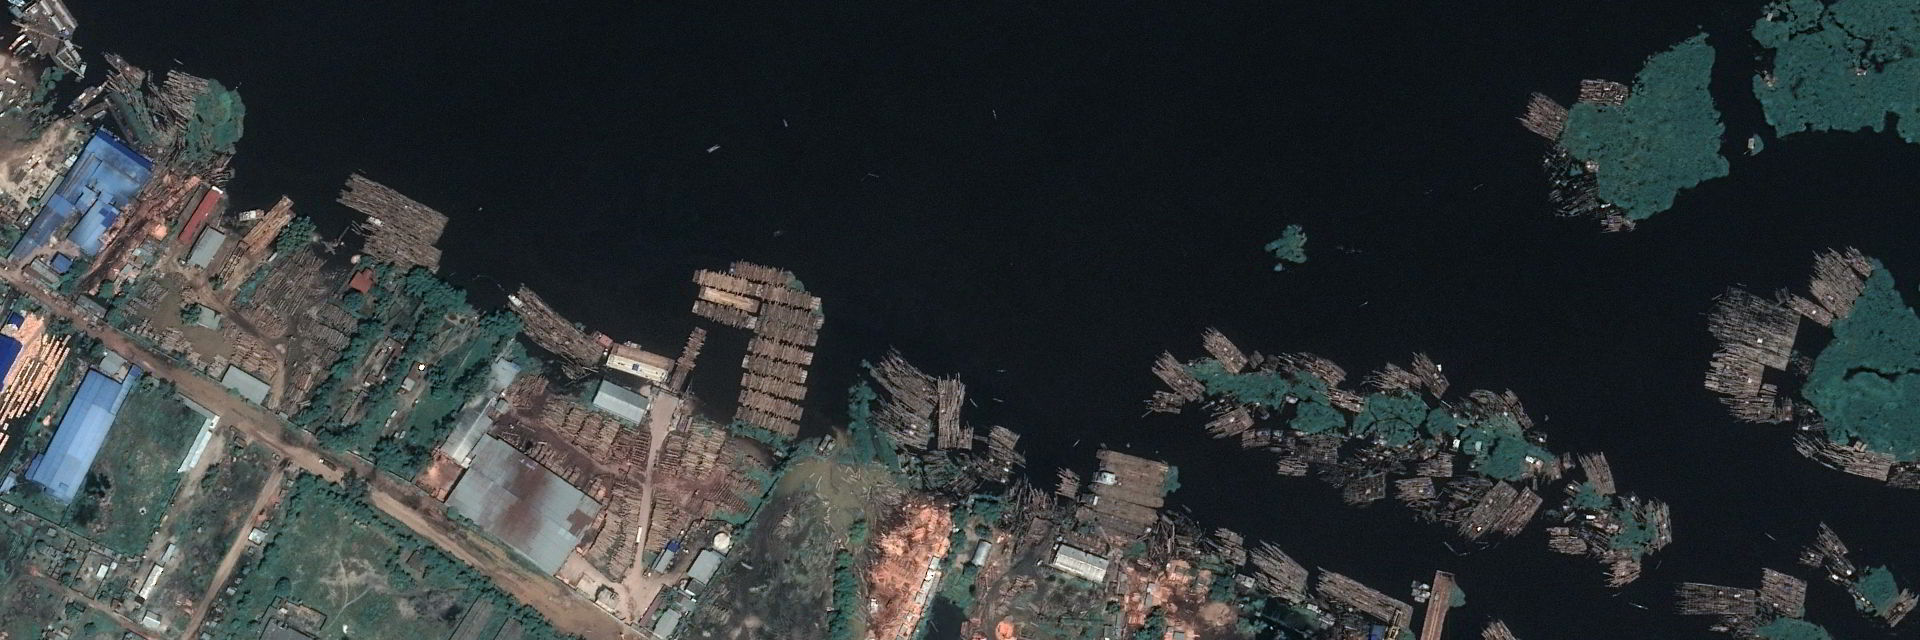
Log stores along the Congo river near Kinshasa, -4.32° Latitude, 15.5° Longitude, January 2020. Imagery © 2021 Google Earth, © 2021 CNES/Airbus
Summary
In this report, Eoghan Darbyshire assesses the current state of forest loss in conflict areas, surveying the changes and hotspots in the past 15 months during the COVID-19 pandemic. This is achieved by combining recently released global forest loss maps, deforestation alerts on the Global Forest Watch platform, and high-resolution imagery recently made publicly available by the Norwegian government.
Key findings
- Deforestation is an ongoing concern in many conflict-affected and post-conflict countries, with many of the drivers linked either directly or indirectly to the conflict. The drivers are diverse, but they have in common that they are allowed to flourish by weak institutional environments.
- In 2020, there was a sharp increase in forest loss in most conflict-affected countries, which in some can be tentatively linked to COVID-19, either through economic hardship or organised crime taking advantage of distracted institutions.
- In total, and across all conflict-affected areas assessed, forest loss increased by 10% in 2020 to 3.2 million hectares. Based on the woody biomass lost in tropical areas only, this amounts to approximately 1.1 mega tonnes of CO2 – nearly four times the total emissions from the UK in 2020.
- The country of most immediate concern is Myanmar. Since the military coup in February, there has been a proliferation of logging of primary rainforest, reportedly being illegally exported to the surrounding countries. It is unclear how long this deforestation spree will last, or what shape it will take – the military junta has historically used logging as a short-term revenue flow.
- Another country of concern is the Democratic Republic of Congo, home to forests with the highest ecological and climate value, and the highest number of people in urgent need of humanitarian assistance. There has been an 8% increase in forest loss since 2019.
- More in-depth research is required to map the conflict-deforestation relationship in more detail, and to provide data than can help break the link by promoting economic alternatives to deforestation in conflict-affected areas.
1. Introduction
Deforestation is an ongoing issue in many conflict-affected and post-conflict countries, and is often associated with a location-dependent mix of drivers linked to insecurity. Whilst providing a temporary boon to the deforesters, the longer-term impacts can be significant for local livelihoods, biodiversity, meteorology and habitability. The cumulative carbon emissions and carbon-sink loss are also significant for the global climate.
Furthermore, and against the backdrop of COVID-19, recent work shows how deforestation – especially in tropical areas – is strongly linked to outbreaks of zoonotic diseases. In a healthy and biodiverse forest, diseases are filtered and blocked but, following deforestation and land conversion, specialist species die off, leaving generalists like rats to thrive. These are the species most likely to be co-hosts to human-shared pathogens. This has already happened, with Ebola outbreaks significantly associated with forest loss in Central and West Africa. The risk of zoonotic spill over is higher than ever, and scientists are now urging more investment in the prevention of deforestation for this reason.
Data we used
As deforestation is often a slow march rather than a large single event, smaller or selective incidents can go unnoticed. However, in recent years satellite data has improved in spatial resolution, is more frequent, and is more democratised, allowing for monitoring to be improved.
The 2020 global forest loss maps were recently released by the University of Maryland, extending a forest loss data set going back to 2001. Reviews of the global forest dynamics can be found elsewhere, but in this report we focus on conflict areas and summarise the losses and trends.
In 2020 the Norwegian government, through the Norwegian International Climate and Forest Initiative (NICFI), funded the public release of high-resolution (5 m) commercial satellite data for deforestation monitoring. Monthly mosaics for 45 million km2 of tropical forest are now available. In this article we use these mosaics in cohort with the deforestation alerts on the Global Forest Watch (GFW) platform.
The alerts automatically compare recent and historical satellite data to identify areas where the forest canopy has been disturbed. Optical imagery from the NASA Landsat satellite is used for the Global Analysis and Discovery (GLAD) alerts, and are provided at a 30 m2 spatial resolution, capturing each location approximately every week – clouds allowing. To overcome cloud cover, the Radar for Detecting Deforestation (RADD) alerts make use of cloud penetrating Sentinel-1 radar data, whilst also being provided at 10 m2 spatial resolution – so allowing a better insight into selective logging. The RADD alerts are only recently available, and only for tropical Africa and South-East Asia. Note that these alerts are just that – they do not mean deforestation has definitely occurred and this is up to the researcher to analyse further.
We combine the alerts with the high-resolution NICFI-funded imagery to illustrate case studies in a number of active and post-conflict countries, and use these to investigate the wider deforestation context in the country – in particular how it is associated with conflict, and the possible role that COVID-19 has played. The countries we explore in more depth are Colombia, the Democratic Republic of the Congo (DRC), Myanmar, Senegal, South Sudan, Syria and Vietnam.
Purpose of this report
The aim of this report is to provide a picture of deforestation in tropical locations since the start of 2020. The work here is by no means a full-scale assessment, and indeed the purpose of illuminating this deforestation is to showcase the recently available data and spark more research into the scale, impacts, and conflict dimensions of the forest loss.
Such research can be academic but in addition, given the open nature of the data, interested citizen scientists can get involved – either formally though programmes like ForestEyes, or informally. Please get in touch if you have found any important deforestation events in conflict areas.
2. Summary of changes in 2020
Based on the University of Maryland global forest loss maps and analysis via the GFW platform, Table 1 summarises the forest loss status in 2020 in conflict-affected and post-conflict countries. Hereafter, for brevity we refer to the global forest loss data as the Maryland dataset.
The most forest was lost in the DRC, which lost the equivalent of more than 1.8 million football pitches1, followed by Angola (just over half a million pitches), Colombia and Myanmar (just under half a million pitches).
In the majority of conflict-affected countries, there was an increase in forest loss during 2020. The country with the largest absolute change in forest loss area was Angola – where an additional 163,000 football pitches were lost compared to 2019 – followed by the DRC, and Colombia. The country with the largest percentage change relative to 2019 is Syria, where forest loss increased by 159%, followed by Afghanistan (111%), Ukraine (78%), Angola (44%) and Lebanon (26%). With the exception of Afghanistan, these countries also have forest loss rates in excess of the 2000-2019 average, as do Uganda, Vietnam, the Central African Republic, Cambodia and Venezuela. In fact, the only countries with lower forest loss rates than both 2019 and the 2000-2019 average are South Sudan and Ethiopia.
The scale of this forest loss for biodiversity, local climate, conflict and zoonotic spill over is likely to be significant, but remains unclear without further work. The data does allow an insight into the scale of the global climate impact, with the CO2 emissions calculated for aboveground biomass loss in the tropics. The sum of CO2 emissions in 2020 from these selected conflict-affected countries was 1,135 Mt. To put this value in context, it is nearly four times higher than the total annual eCO2 emissions from the UK (326 Mt). What’s more, this value is possibly conservative, as it does not include other carbon losses associated with the forest loss, such as fire, soil degradation, post-clearance land use (such as cattle ranching), or future additional CO2 sequestration.
In some countries, the combined effects of climate change and deforestation are already being felt – for example, they were considered the two main factors that contributed to severe flooding in Afghanistan in 2020. It is for this reason that although the deforestation appears relatively small in the drier conflict countries, the recent increases are particularly noteworthy. Where there is already minimal tree cover and the effects of climate change are being felt, such as the Middle East, any loss is significant given the consequences for farming, floods, soil erosion, dust storms and desertification.
| Country | Conflict status | Tree cover in 2000 (kha) | Forest loss 2020 (ha) | Main hotspot* | CO 2 2020 (Mt) | Change since 2019 | % change from mean forest loss | % forest lost since 2000 | Primary humid forest loss 2020 (ha) | |
|---|---|---|---|---|---|---|---|---|---|---|
| Area (ha) | % | |||||||||
| Democratic Republic of the Congo | active | 227,775 | 1,334,944 | Tshopo | 537 | -98,958 | -8 | -70 | 7.1 | 490,613 |
| Angola | post | 95,925 | 386,284 | Bié | 66 | -118,097 | -44 | -76 | 4.7 | 8,918 |
| Colombia | post | 84,502 | 330,198 | Caquetá | 134 | -56,314 | -21 | -43 | 5.6 | 166,485 |
| Myanmar | active | 45,085 | 326,096 | Shan | 125 | 155 | 0 | -61 | 9.2 | 44,445 |
| Vietnam | post | 18,146 | 228,784 | Nghệ An | 74 | 11,694 | 5 | -43 | 18.1 | 32,620 |
| Cambodia | post | 10,199 | 163,190 | Preah Vihéar | 64 | 2,675 | 2 | -26 | 25.8 | 62,295 |
| Venezuela | insecure | 91,249 | 142,366 | Bolívar | 48 | 1,326 | 1 | -26 | 3.9 | 53,702 |
| Uganda | post | 18,357 | 88,157 | Luwero | 16 | -12,204 | -16 | -74 | 5.7 | 3,585 |
| Ukraine | active | 13,159 | 82,142 | Zhytomyr | ** | -36,080 | -78 | -53 | 8.4 | n/a |
| Central African Republic | active | 59,986 | 65,826 | Ouham-Pendé | 20 | -1,573 | -2 | -39 | 1.6 | 14,742 |
| Ethiopia | active | 31,135 | 28,004 | Oromia | 7 | 6,959 | 20 | 3 | 1.9 | 4,603 |
| Senegal | post | 4,785 | 4,887 | Ziguinchor | 1 | -801 | -20 | 26 | 2.7 | 1 |
| Syria | active | 147 | 3,505 | Lattakia | 28 | -2,151 | -159 | -190 | 18.0 | n/a |
| South Sudan | active | 42,730 | 3,160 | West Equatoria | ** | 1,544 | 33 | 72 | 0.5 | 86 |
| Lebanon | post | 94 | 598 | Mount Lebanon | 16 | -125 | -26 | -136 | 5.7 | n/a |
| Afghanistan | active | 432 | 40 | Kunar | ** | -21 | -111 | 60 | 0.4 | n/a |
| Total | 3,188,181 | 1,135 | 882,095 | |||||||
Table 1. Deforestation statistics for selected conflict countries in 2020. Data from the Global Forest Watch platform ‘analysis’ functionality, based on University of Maryland Global Forest Loss data. This is not a comprehensive list of conflict-affected and post-conflict countries, rather a selection based on locations where forestry has been a prominent part of the conflict’s environmental discourse, or having significant primary tropical forest stocks, or having large tracts of forests potentially protected by unexploded ordnance. Statistics presented are for pixels with >=10% canopy cover – chosen so that forest loss in the Middle Eastern countries would be captured better. Note, however, that choosing a different threshold gives slightly different results – the Global Forest Watch platform’s default is 30%. Furthermore, no information on forest gain is included, the data presented is just for losses.
*The first-level administrative area with the largest area of forest loss in 2020.
**Emissions data not available for non-tropical countries.
The spatial distribution of historical and recent forest loss in conflict-affected countries is illustrated in Figure 1, with each image showing a closer view of a hotspot area of concern. Not all the countries in this table are considered in this report, this includes Ukraine, where near Luhansk the deforestation increase in 2020 was stark – up 428% on 2019. In Tigray, Ethiopia the forest loss was relatively small (466 ha) compared to other regions in the country (e.g. Oromia lost 18,311 ha).
Some caution is required in interpreting results from the Maryland dataset. For a start, it reports forest loss, which is not necessarily the same thing as deforestation, including the role of fires, storms, floods or disease. Further, the data does not give an indication of selective logging or forest degradation – a recent study underlined the scale and importance of degradation as a precursor to loss. It would be beneficial to have a concurrent annual dataset on degradation and disturbance, to help understand future change.
For example, as a direct result of the recent fighting in Nagorno-Karabakh, approximately 10,000 ha of biodiverse forest was burned – this damage is not clear in the dataset. Furthermore, the dataset does not cover all forestry – only that which is greater than 5 m in height. This means there is no consideration of countries like Yemen, despite the important tree cover present – ranging from relict tropical forest to unique Dragon’s blood cloud forests – and the ongoing fuel crisis driving deforestation.
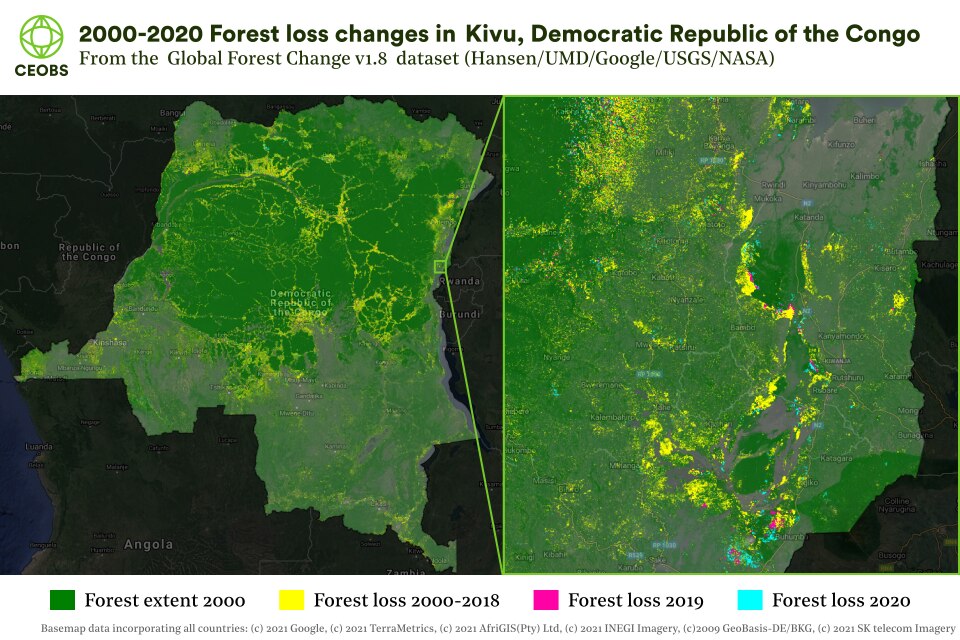
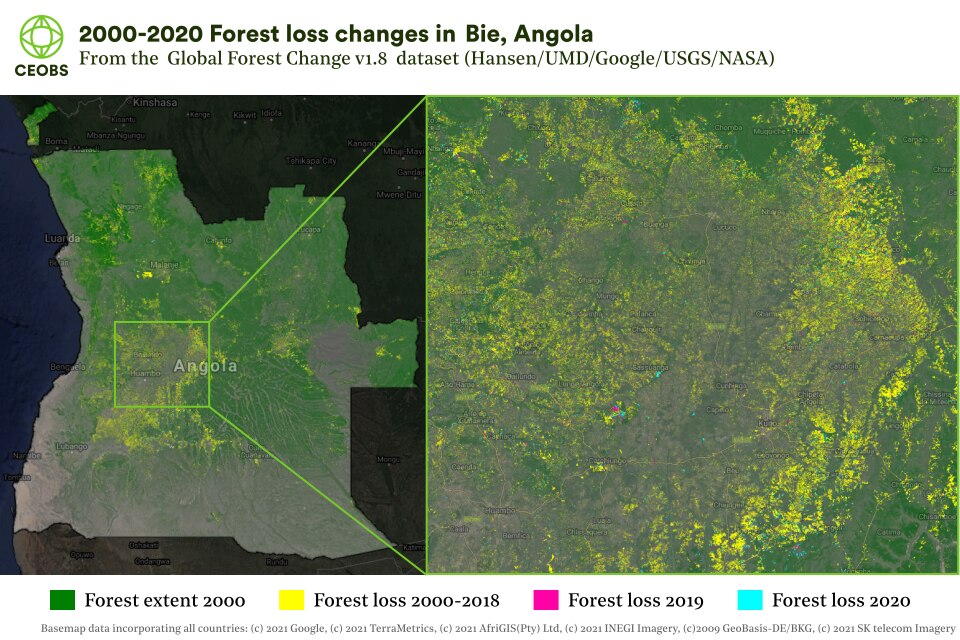
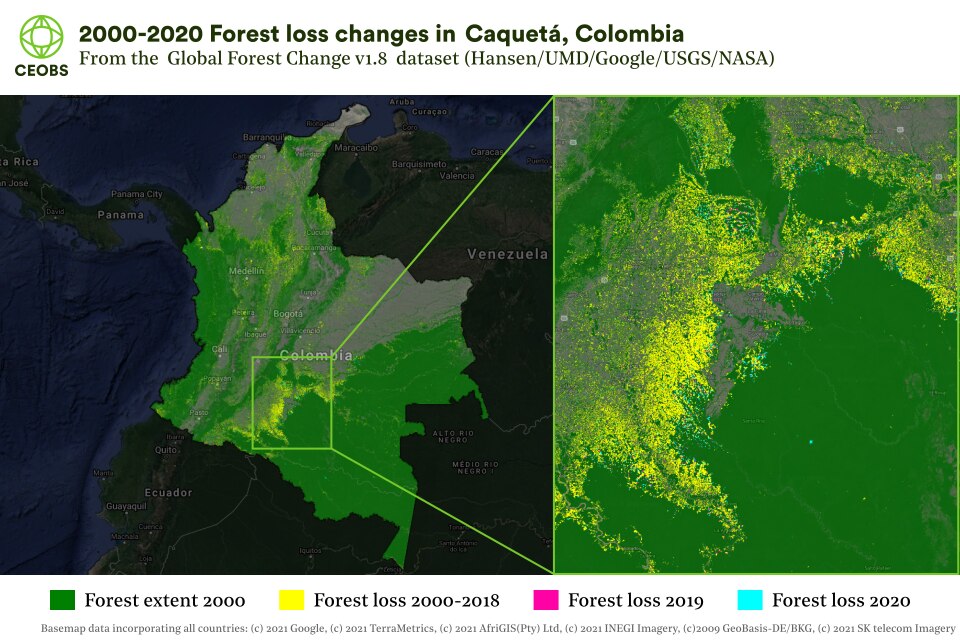
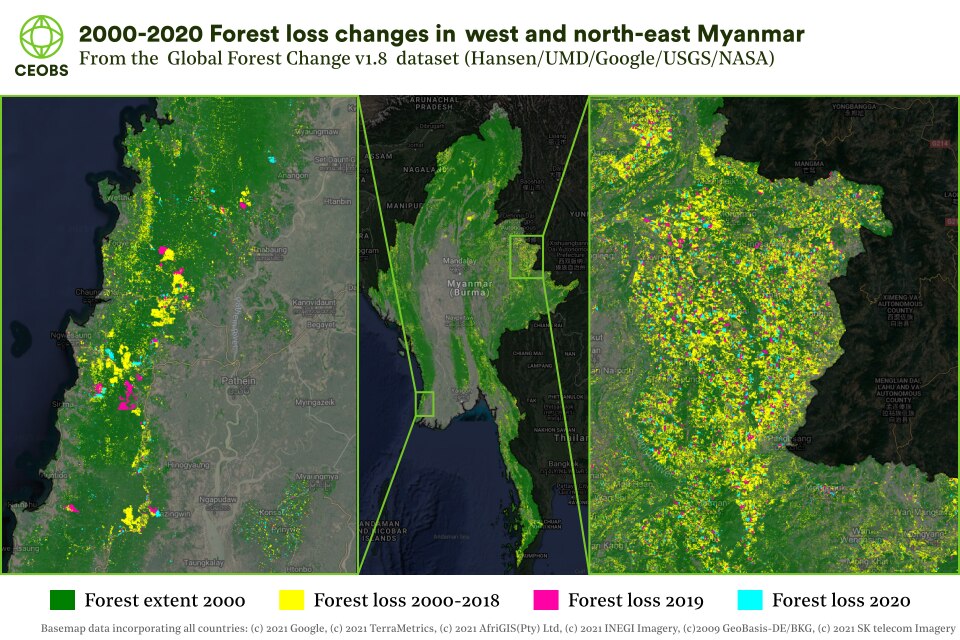
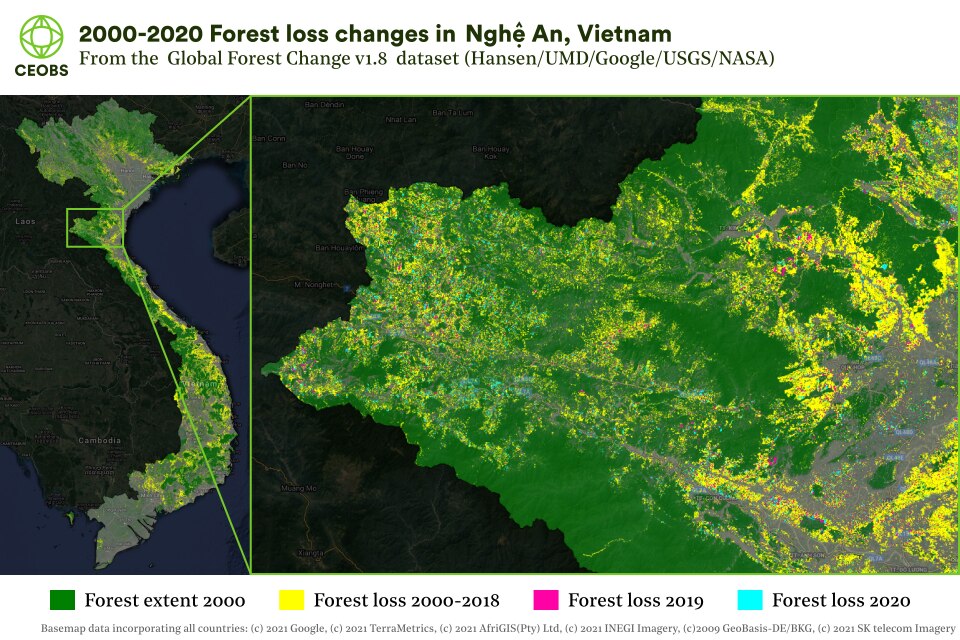
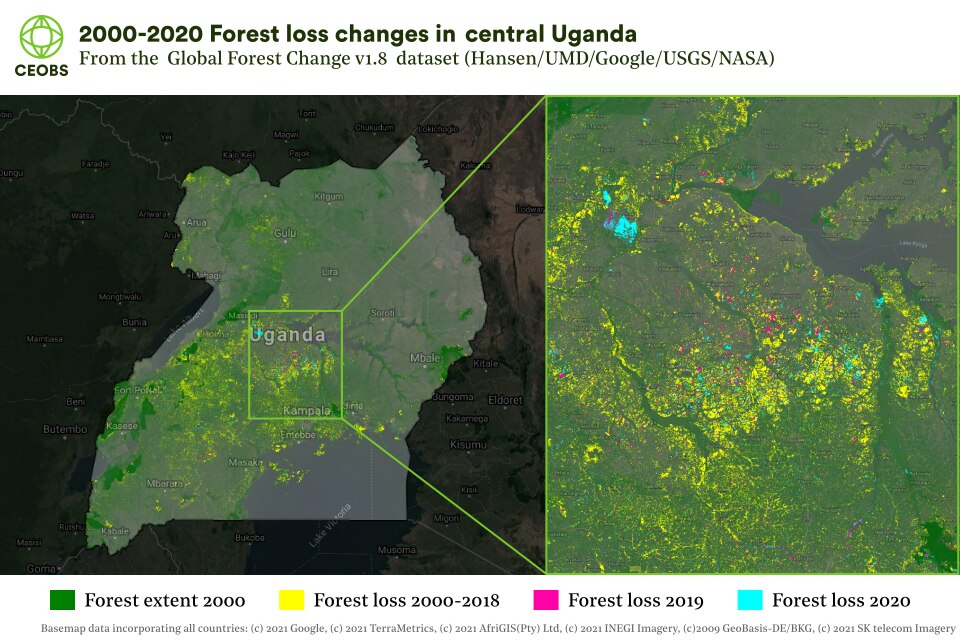
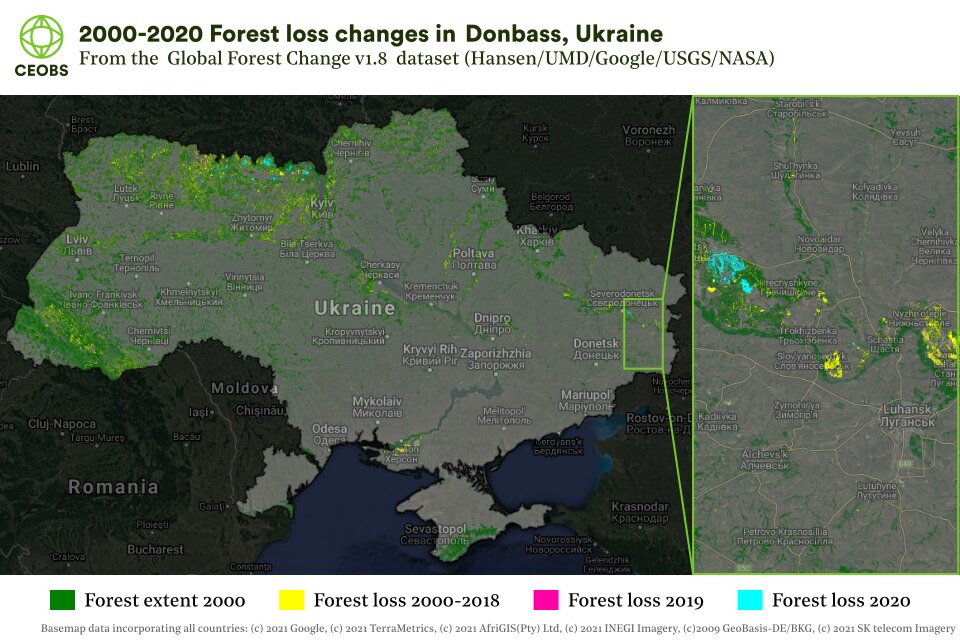
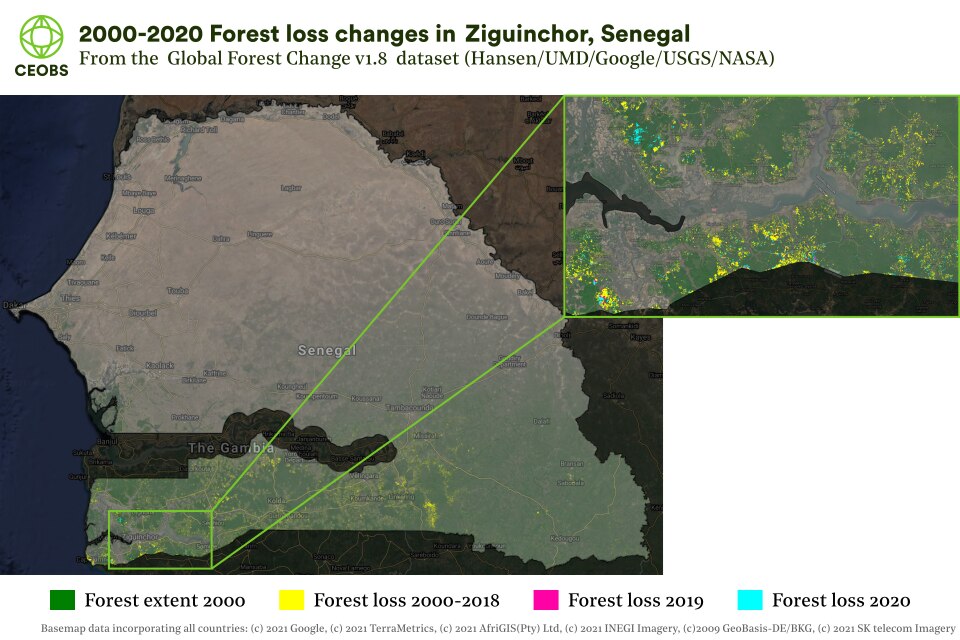
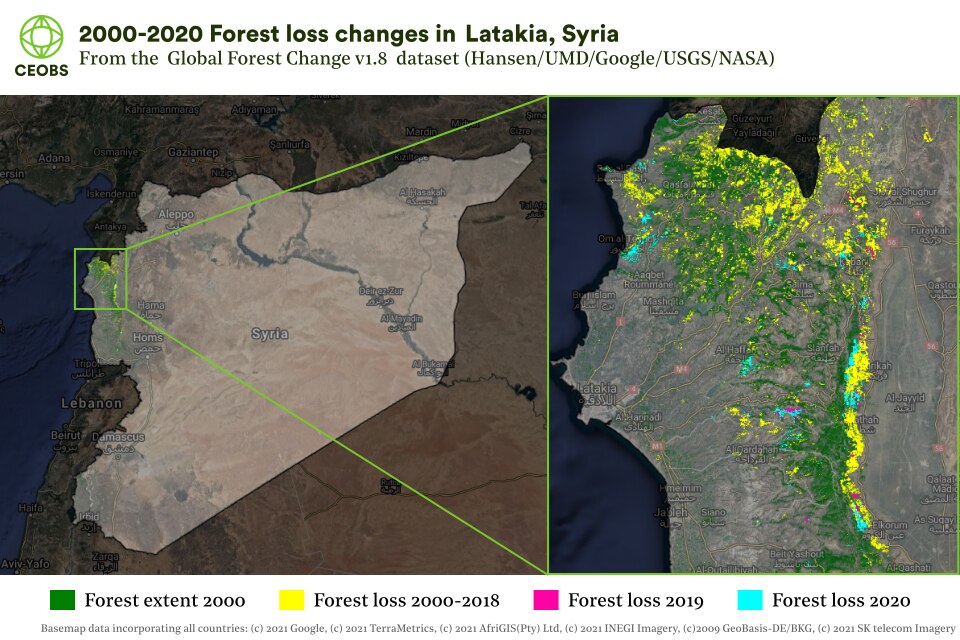
Figure 1. Deforestation maps in conflict countries, with losses in 2019 and 2020 highlighted. Data from the University of Maryland Global Forest Loss v1.8, processed in Google Earth Engine. Click left/right to toggle between countries.
3. Countries with ongoing conflicts
3.1 Myanmar
There already appears to have been an increase in deforestation in response to the military coup of 1st February this year. This comes in the wake of hugely increased deforestation rates in 2019 and 2020, when logging rates were unsustainable and vastly underreported by the government. Myanmar has reserves of the most valuable ancient teak on the planet, used for the luxury yachts of billionaire clients. Much of the forest covered by the recent alerts is considered high in structural integrity, i.e. it has a significant ecological value and ought to be conserved over less structured tropical forests. Furthermore, 70% of the population lives in rural areas and is dependent on the forests for their livelihoods. The ongoing deforestation is reported to be disorganised and chaotic – a far cry from past criminal syndicates – but many forest monitors are either in hiding, on the run, or part of the civil disobedience movement.
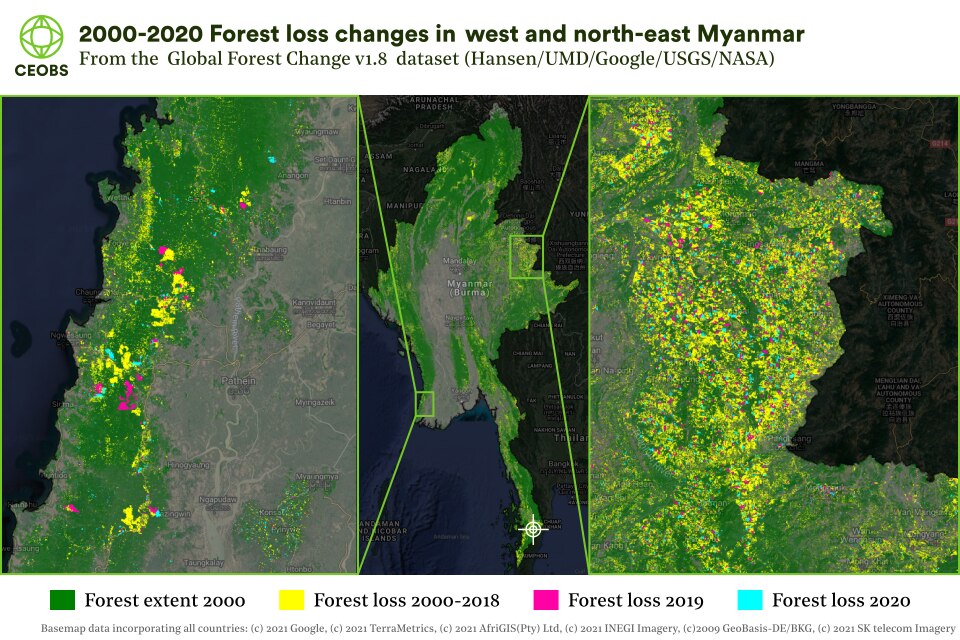
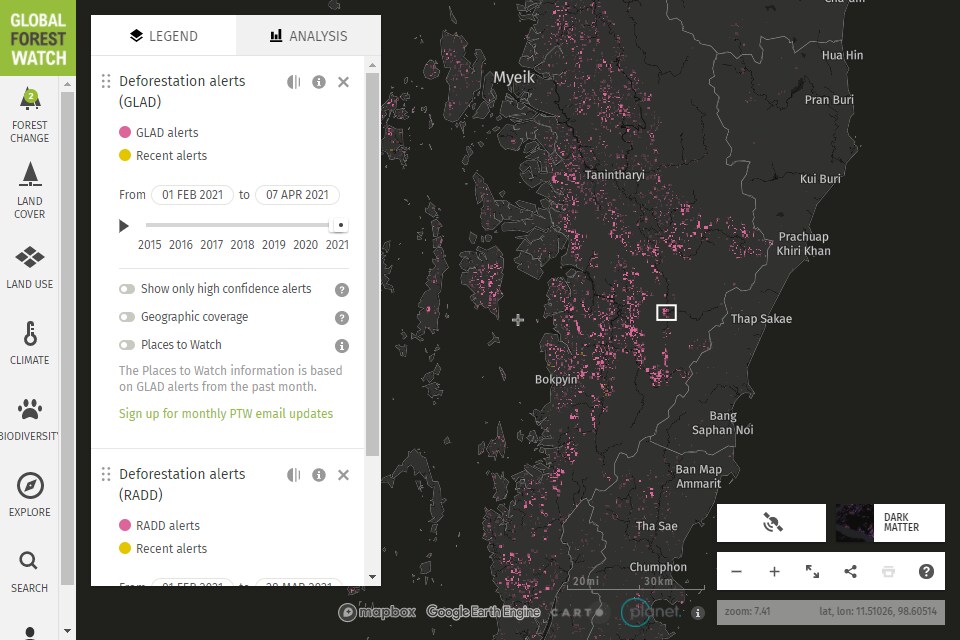
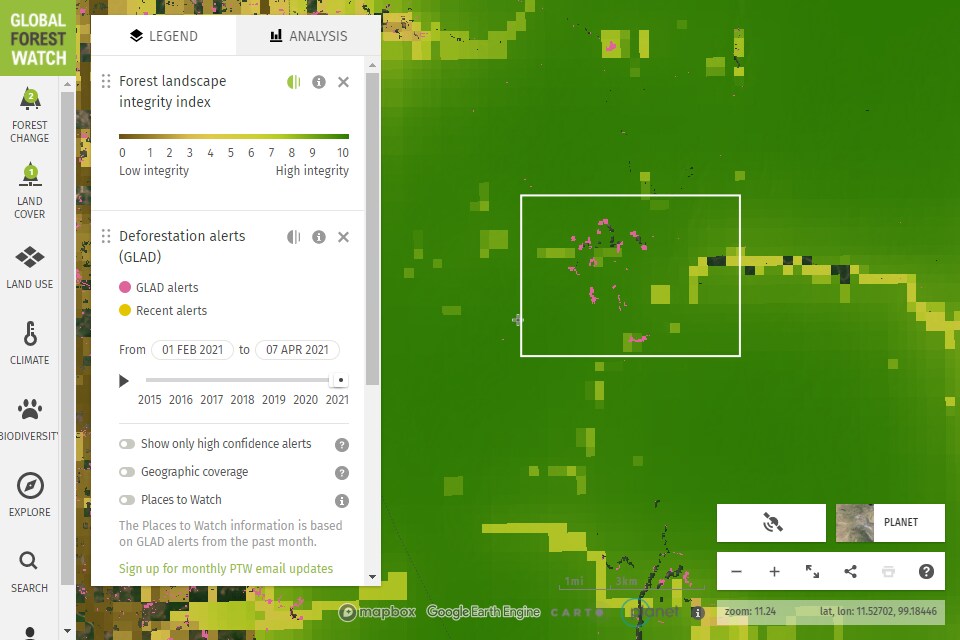
Figure 2. a) Forest loss in Myanmar based on the Maryland dataset. The white target indicates the location of the example case. b) GLAD deforestation alerts in southern Myanmar since February 2021. c) The high forest integrity index overlain over the example case area. (b) and (c) are from the Global Forest Watch platform and the green box highlights the bounding box of the example case in Figure 3. Click left/right to toggle between figures.
The logging to date could be a portent of further losses to come – unsustainable felling, especially of teak, has previously been used by the military leadership as a short-term revenue flow to combat sanctions and prop up the economy. Already there are sanctions from the US, Britain, Canada and the EU, international companies are cutting links, and to avoid complicity, blacklists of companies linked to the military have been compiled. Ironically, the co-launch of environmental monitoring satellites with Japan has even been postponed.
However, Myanmar can turn to neighbouring nations – timber is travelling overland (previously prohibited) through porous borders to sawmills in China, India and Thailand. Myanmar’s military has an appalling track record in environmental governance. But it does have strong links with China, which was the country’s sole international backer prior to democratisation, and a continuation and amplification of Belt and Road projects is expected. An investigation by Mongabay has found that the current logging is threatening the unique forests in the Tanintharyi region and coincides with military attacks on the Karen communities. The area is home to the last Gurney’s pittas, a critically endangered bird species, and endangered Malay tapirs and lar gibbons.
Example case
The location for our case study is within the Tanintharyi region, and in an area of high structural integrity primary forest, which is within the proposed site of the Lenya National Park. The location is relatively flat and close to the Ngawun Chaung river, which flows into Thailand – the possible extraction route for any timber. Given the remoteness of the location – 20 km to the nearest village (Nan Taung) and reporting conditions on the ground, at this stage we are unable to provide any more context.
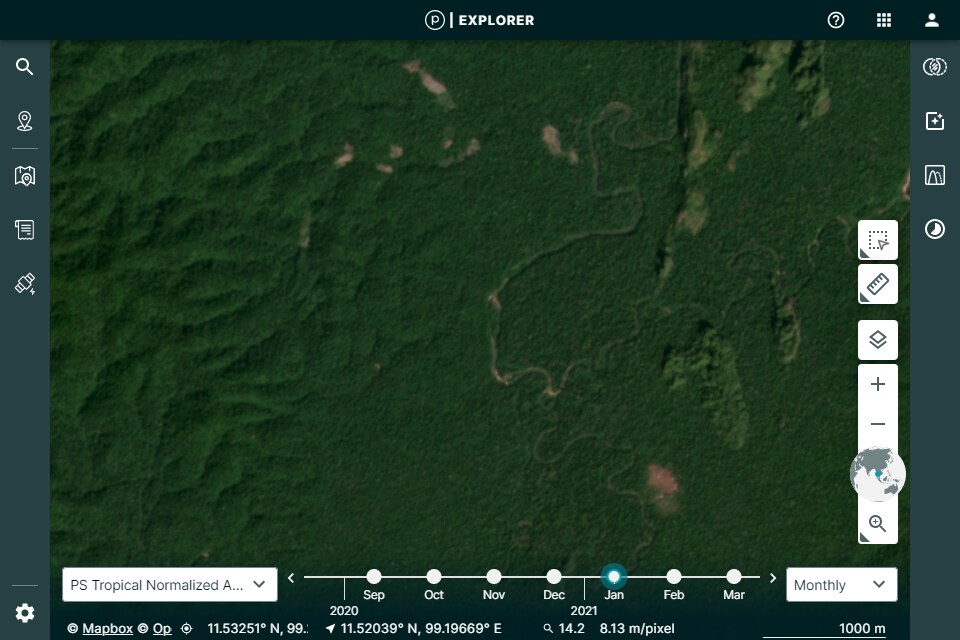
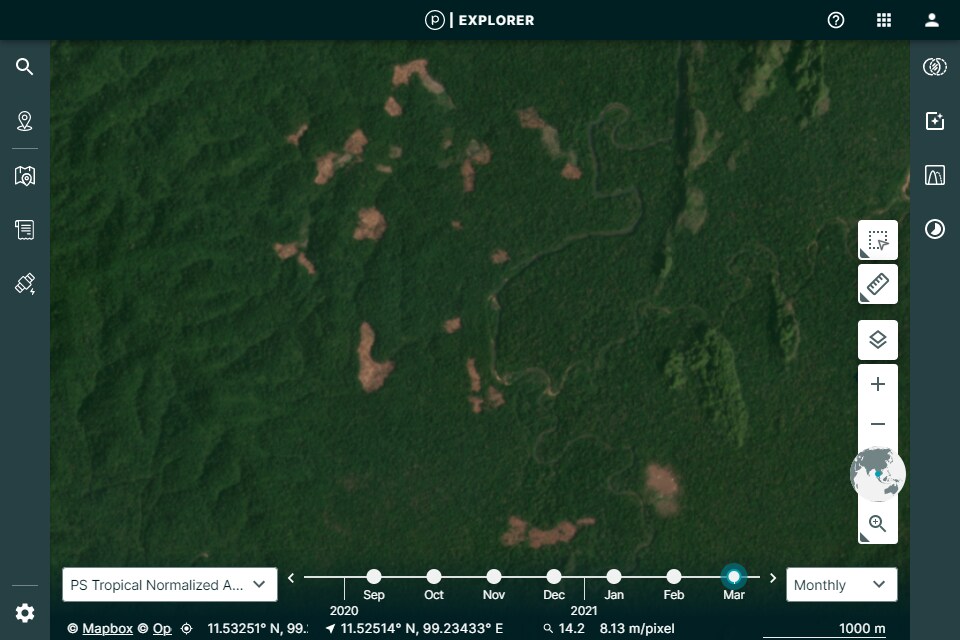
Figure 3. Before/after high resolution satellite imagery for an example forest loss case in southern Myanmar. Cloud free imagery mosaics from Planet.
Backwards steps
This coup-induced deforestation spree is undoing much of the good work enacted by the civilian government – joining REDD+,2 preparing a national forest inventory, export bans, a blanket ban in 2016/17 and significant reductions in logging quotas. However, Naw Eh Htee Wah, a civil society leader told Mongabay that “because of corruption, you can trade and transport your timber easily.” This goes someway to explaining the concessions given to plantations on primary forest and national parks. Further, there have been investigations into European companies evading EU laws to obtain illicit timber and avoid tax.3
Deforestation linked to the Rohingya genocide
Forest loss in the current crisis builds on that resulting from the Rohingya genocide. In Rakhine state, from where the Rohingya fled, there was a 12% reduction in forests following widespread burning and a denuding of the landscape. Furthermore, the refugee camps in Bangladesh resulted in deforestation of more than 7,000 ha, as wood represented the only fuel source, impacting the physical landscape and flood susceptibility.
3.2 Democratic Republic of the Congo (DRC)
The DRC is one of the poorest countries in the world, but resource rich. It is home to vast mineral deposits and 60% of the Congo Basin, a primary rainforest with outstanding biodiversity and a key role in modulating the regional climate. The Congo Basin is second only to the Amazon in size but is currently a more effective carbon sink, whilst below ground it is home to the world’s most extensive tropical peatland. Furthermore, not all forests have the same ecological value and the best ought to be the highest priority for conservation – much of the world’s remaining ‘high structural integrity’ forest is in the DRC.
The DRC has a complex history of conflicts that defies simple explanation, but today is characterised by fragmented and proliferating armed groups, with violence tightly interwoven with resource extraction. This includes both industrial and artisanal mining, to which swathes of forest are lost, and which, according to refugee testament, has changed the shape of violence in the country following the Congo wars. As of March 2021, the DRC has “the highest number of people in urgent need of humanitarian assistance in the world.”
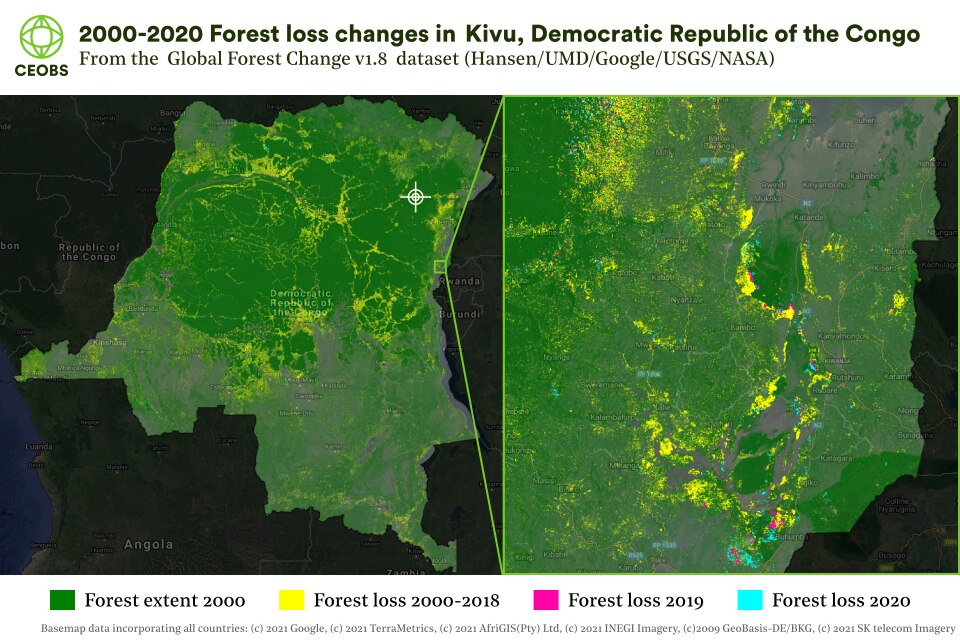
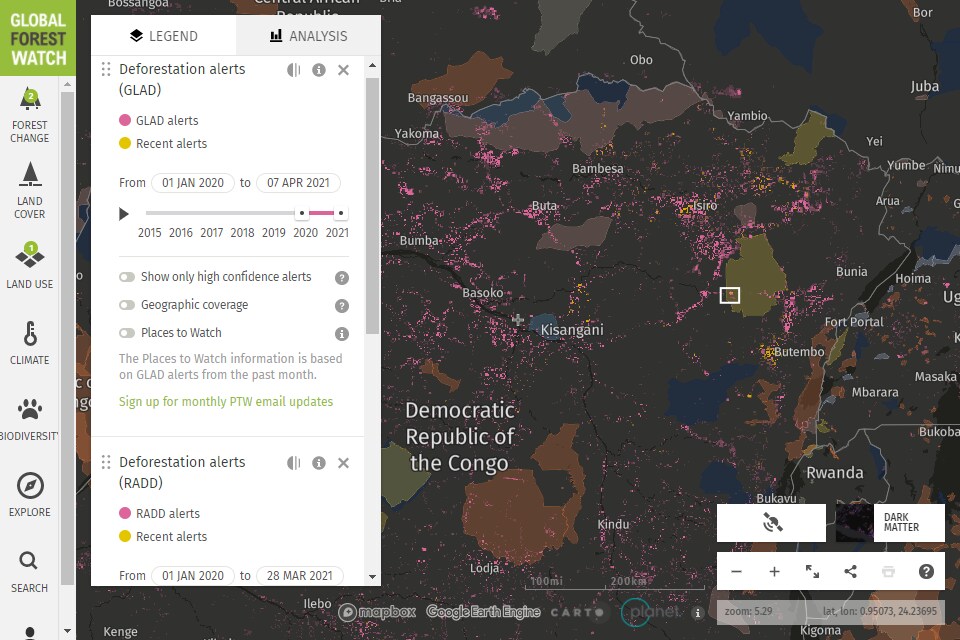
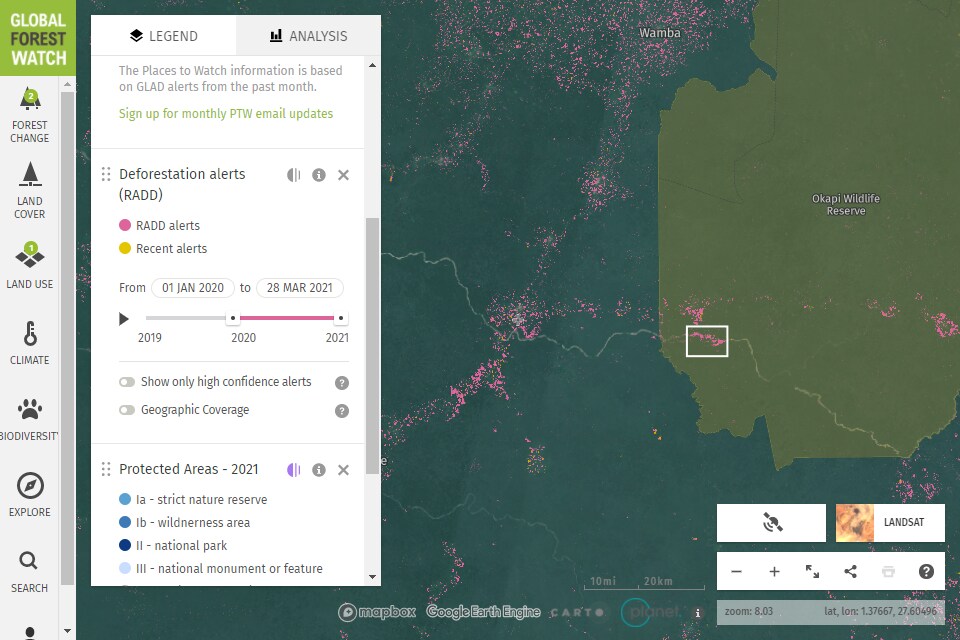
Figure 4. a) Forest loss in DRC based on the Maryland dataset. The white target indicates the location of the example case. b) GLAD deforestation alerts from eastern DRC since January 2020, with Protected Areas overlain. c) A zoom into the example case area, showing deforestation alerts within the Okapi Wildlife Reserve. (b) and (c) are from the Global Forest Watch platform and the green box highlights the bounding box of the example case in Figure 5. Click left/right to toggle between figures.
A 2017 paper by the Central African Forest Initiative stated that the DRC has had “historically low deforestation compared to the rest of the world”. By the end of 2020 though, it was reported that deforestation had surged during COVID-19, and in areas far away from main roads and urban centres. This has now been confirmed with the release of the Maryland dataset. Forest loss has increased by 8% on 2019, and is way above the historical baseline rates, with more than 1.3 million ha lost in 2020 – nearly half a million of which were of primary forest. Much of the recent forest loss is focused in the east of the country, coincident with conflict hotspots and often within Protected Areas.
Drivers of deforestation
The primary cause of forest loss in DRC is weak governance – there is no national plan to combat deforestation – and this is a status that has arisen out of the continuous state of conflict in the country since the mid-1990s. Implementation of REDD+ is at a standstill. Although the DRC is a signatory to 29 international conventions, and has enacted more than 40 domestic environmental laws, there is weak implementation. Similarly, agricultural, tenure and land use reforms have been announced but they have not materialised. According to a 2020 report by the Center for International Forestry Research, this is due to a lack of finance, capacity and political will.
It is estimated that smallholder clearing accounts for nearly two thirds of recent forest losses, as land is cleared for subsistence farming, fuel, wood and charcoal production. As conflict has forced people deep into the rainforest, causing environmental destruction on route, these losses are evident even away from urban centres. Fundamentally, people have very little option other than to remove forest; speaking to Mongabay Prof. Matthew Hansen, one of the world’s foremost experts on deforestation, summarised it thus:
“The DRC is a stateless place where there are no cheap food imports, no oil exports and little food aid. Thousands of people are pushed into the forests to feed themselves. It is a horrible dynamic.”
As smallholder clearing is tightly coupled to population growth, there is concern at the effect of the DRC’s increasing population – at current rates all of the DRC’s primary forests will be lost by 2100. Furthermore, a recent study in Nature indicates DRC is particularly vulnerable to the amplification effects of climate change, and concluded the future of the country’s forest is the most uncertain in all of central Africa.
Commercial logging, mining and plantations are responsible for nearly 12% of deforestation surrounding villages and towns, although this may increase in the face of external pressures. However, as the rate of deforestation is actually significantly lower in concessions managed by communities rather than industry, there is a growing movement to widen community forest management – including smaller scale logging and sustainable agriculture – beneficial for the forest and livelihoods.
Speaking to PBS, Greenpeace forest manager Irene Wabiwa Betoko explained: “Governance in Congo is very poor. Corruption is very high. So, when you have power, you have money, you can do what you want in the forest sector.” Corruption accusations have been made against mining giants and have even played out on the political world stage. Nonetheless, there are some beacons of hope from an active civil society, with more than 100 organisations operating despite no proper recognition in the country’s legal framework. Domestic groups have mounted a legal challenge against a minister for breach of the country’s forest laws, while local and international innovations to reduce charcoal usage also represent a step forward.
Cascading impacts of war
One response to the ongoing violence has been the militarisation of conservation efforts, which has set off a vicious cycle of violence leading to the murders of park rangers, but also their implication in human rights abuses. Conflict hotspots between rangers and armed groups include the Virunga national park, an area of protracted and complex violence, and the Garamba national park, home to the so-called ‘Elephant Wars’. Rangers are targets as they attempt to halt illegal wildlife crime or resource exploitation, including deforestation for charcoal production. Such is the dysfunction, in January 2021 a joint civil society statement called for a totally new model of conservation, devolving power to local groups to help avoid deforestation.
In addition to deforestation, the DRC has a number of additional environmental threats as its ungoverned spaces are exploited. There are plans afoot to drain the peatlands for oil extraction, and tenders have recently been released for 19 oil blocks in the forest. Bushmeat hunting represents a significant threat to wildlife and humans too, through the spread of zoonotic disease. Eco-tourism ought to be a major income stream and help preserve forestry – however the sector’s growth has been restricted by the conflict and incidences of tourist kidnappings.
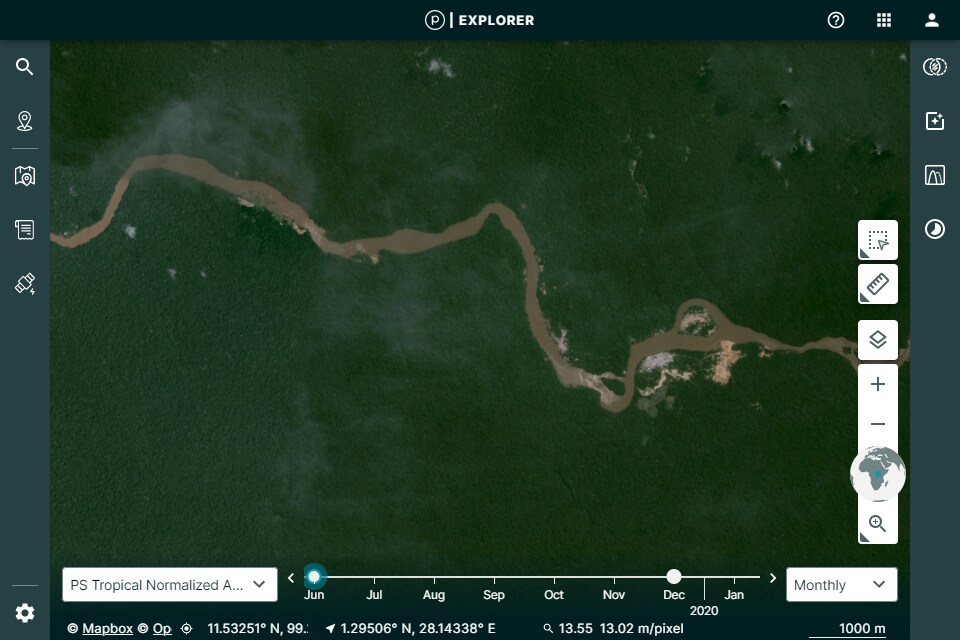
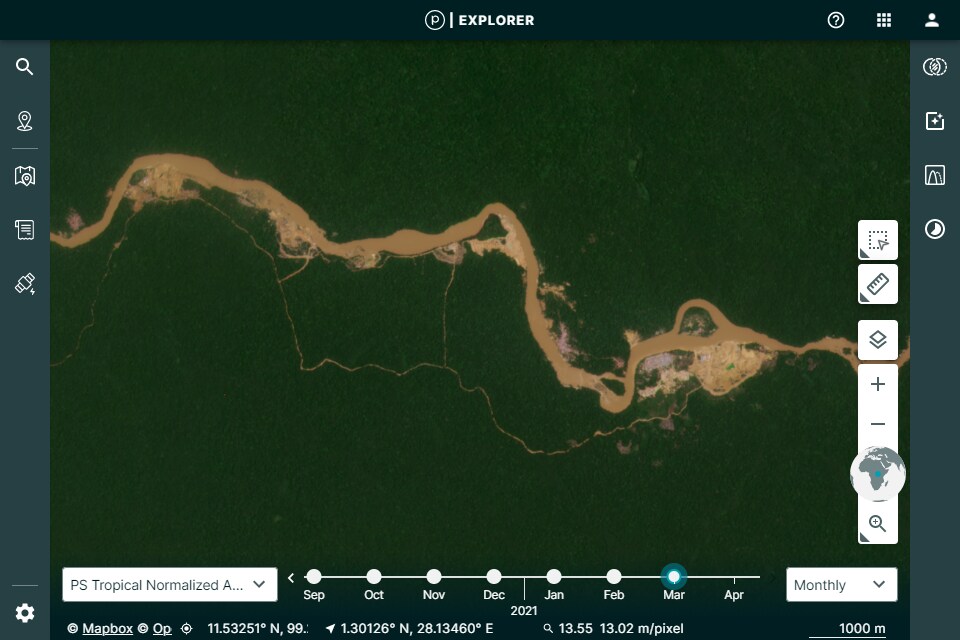
Figure 5. Before/after high resolution satellite imagery for example forest loss case in eastern DRC. Cloud free imagery mosaics from Planet.
Example case
An additional source of deforestation is via clearance for illegal mining, which is illustrated in Figure 5. This case study features the loss of several hundred hectares of primary forest within the Okapi Wildlife Reserve, a World Heritage Site in the Ituri forest, but with a history of industrial-scale and artisanal gold mining. Guided by the GLAD and RADD deforestation alerts, Planet imagery illustrates the development of multiple mining sites and roads along the river Ituri, between the start of 2020 and March 2021. We are unable to ascertain if the mining is artisanal or a more organised operation – although the former has declined during COVID-19, which may itself be fuelling further insecurity. The nearest settlements are Adusa and Basiri, and the area has suffered historical and recent violence against park rangers, as armed groups have taken advantage of the COVID-19 crisis – part of a wider regional picture of rising insecurity at the often unsafe mines.
3.3 South Sudan
Unlike the neighbouring DRC, Uganda and Ethiopia, levels of deforestation in South Sudan are relatively low, there has been a decreasing trend in deforestation since 2004 and 2020, and 97% of its primary forest remains.
The majority of recent forest loss in South Sudan has occurred in Western Equatoria along the border with the DRC. Beyond the reach of governments, there is a history of cross-border arms and wildlife movement in this peripheral area – while illegal logging has financed arms groups in Eastern Equatoria.
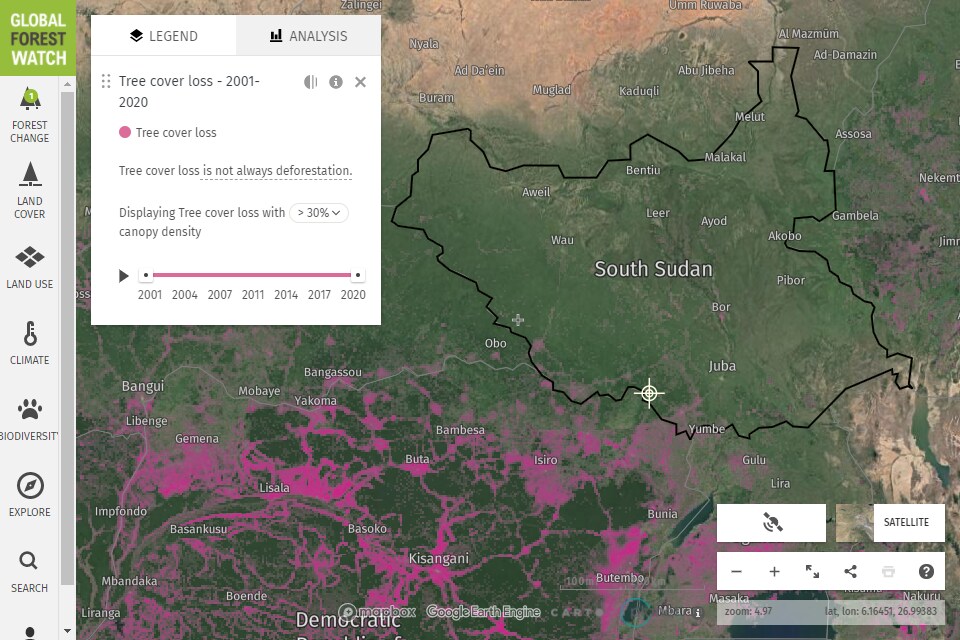
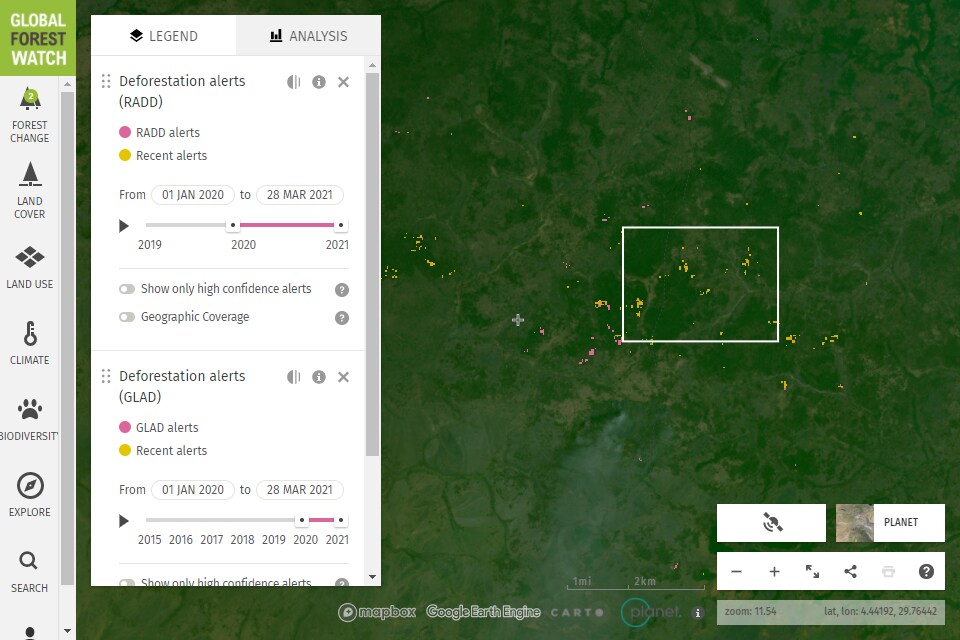
Figure 6. a) Forest loss in South Sudan 2001-2020 based on the Maryland dataset. The white target indicates the location of the example case. b) GLAD and REDD deforestation alerts over the example case area since January 2020. (a) and (b) are from the Global Forest Watch platform and the white box highlights the bounding box of the example case in Figure 7. Click left/right to toggle between figures.
Over the past three decades conflict has been ever present, and instability has been exacerbated during the COVID-19 pandemic – the economy has crashed as oil exports fell, leaving many without pay. Fighting has resulted in forest loss primarily through illegal charcoal burning by those it has displaced, but also via the illegal, armed and unsustainable trading of timber by foreign firms.4
The government has been relatively progressive in its pursuit of deforestation goals. In 2018 the export of charcoal was banned, although it remains the favoured fuel domestically. The country aims to be carbon neutral by 2030, and avoiding deforestation and promoting tree planting is a key component of this goal – if it can be financed. This is uncertain in the COVID-19 era, with UK aid alone set to drop by 59%. Furthermore, capacity remains limited – although the Paris Agreement was ratified in 2017, the documentation was only deposited with the UN in February 2021. Moreover, fighting has also had a host of additional environmental impacts requiring redress, whilst support is needed for the unprecedented flooding and acute food crises affecting millions. Climate change also looms: South Sudan is highly vulnerable, with impacts already being felt – it was the 8th most affected country in 2019. However, despite these challenges, reforestation has already started in some areas through partnerships with the FAO and UNHCR.
Example case
There is clear forest loss between November 2020 and February 2021 in the Lantoto National Park, adjacent to the DRC border. The smoke plume visible in Figure 3 suggests ‘slash and burn’ – satellite fire monitoring shows many burns in 2021 – whilst there are recent reports that poaching is on the rise. Is this a location of rapid change and resource exploitation?
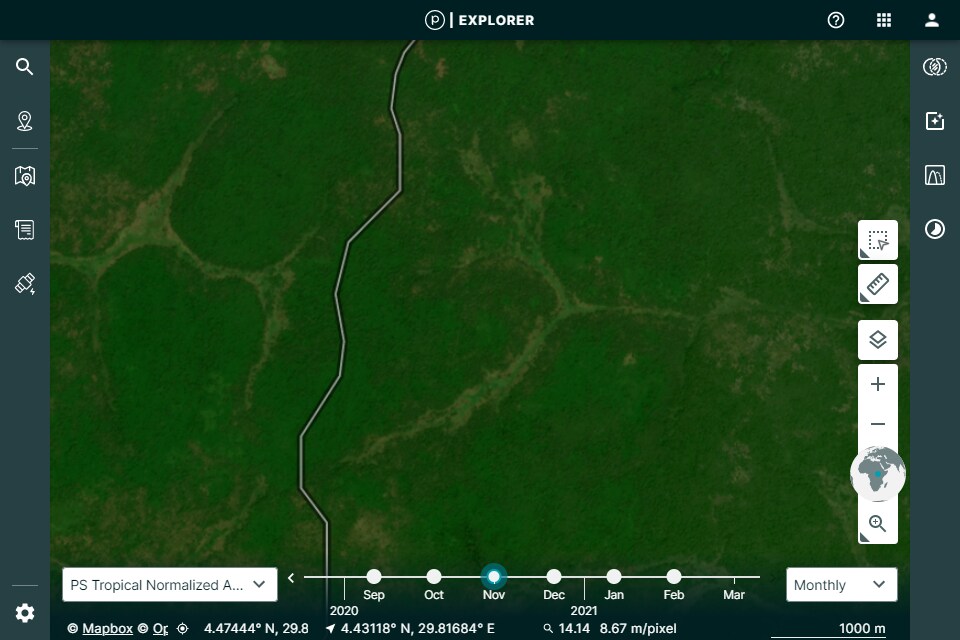
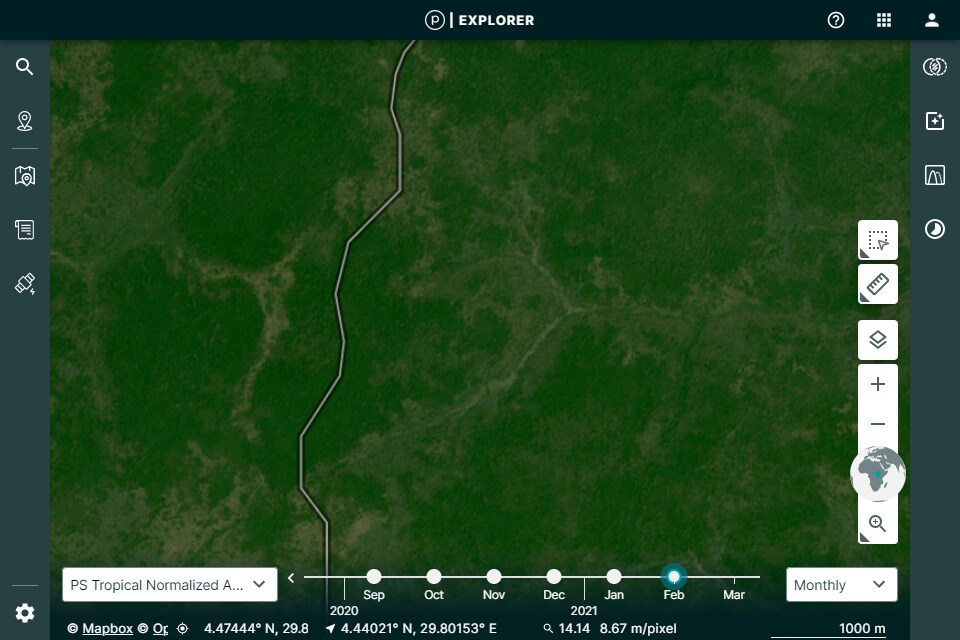
Figure 7. Before/after high resolution satellite imagery for example forest loss case in western South Sudan. Cloud free imagery mosaics from Planet.
In short, no. What we see is forest loss not deforestation, and perhaps an example of the risks of superficial analyses. The forest landscape in this location is typified by dry season wildfires, and the recent months have been no exception, with fire impacts reported across Western Equatoria. In fact, this region sees a decreasing trend in burned area between 1998-2015. However, it is a different story in eastern South Sudan, with burned area showing an increasing trend. This poses questions about fire management and future forest loss in the country, which to our knowledge are not currently being addressed at a governmental level. Such planning is required for South Sudan to reach its potential as a tropical forest ‘good news story’.
3.4 Syria
The Maryland dataset indicates that 3,505 ha of forest were lost in Syria in 2020, a 159% increase on 2019, which means that nearly 20% of Syria’s forests have been lost since 2000. The current fire hotspots are along the Mediterranean coast near the cities of Latakia and Tartus, home to more than three quarters of the countries’ forested areas and, as a result of conflict-linked displacement, a significantly swollen population.
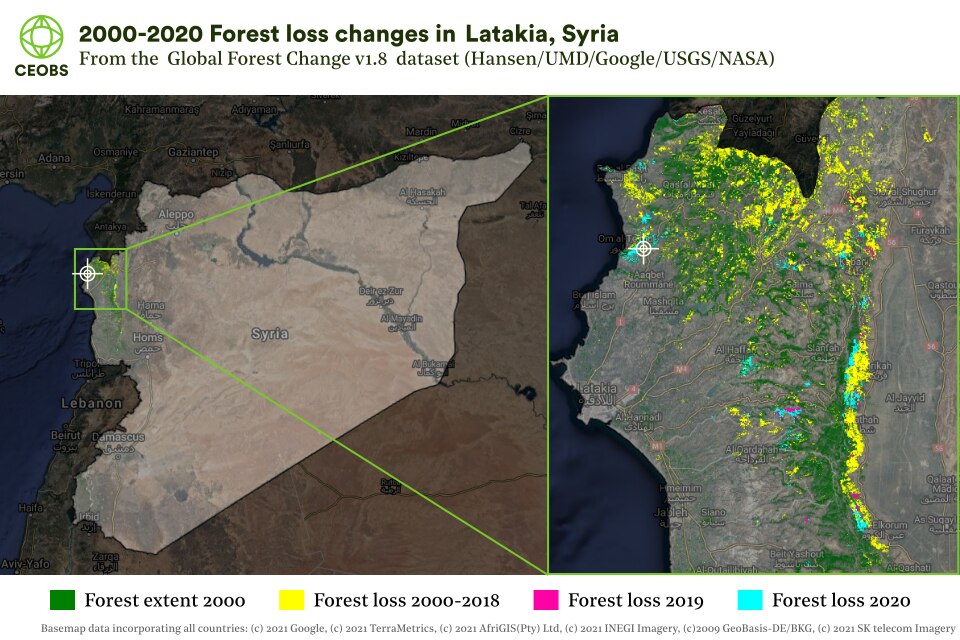
Figure 8. Forest loss in Syria based on the Maryland dataset. The white target indicates the location of the example case.
A recent study confirms the Maryland data, also finding that between 2010 and 2020 nearly a quarter of the coastal forests were lost, amid a significant decline in forest density. In turn, there was an increase in agricultural and desert areas. The rate of forest loss has accelerated in recent years and was found to be associated with proximity to the population, and a 20% increase in fire activity. Crucially, the study found no role for anomalous climatic conditions driving the forest loss – instead drawing a direct link to the conflict.
Conflict drivers
The conflict has impacted tree cover via direct attacks – for example, it is reported that half a million olive trees have been destroyed since March 2018. The primary mechanism for forest loss is through fire. Whilst these can arise through fighting – such as in the contested area to the north east of Latakia, they are mainly a consequence of the conflict’s socio-economic effects. This includes intentional fires, for charcoal production and land clearance, and accidental fires arising from additional population pressures and under-resourced fire services.
From the early years of the conflict, when power infrastructure was attacked, to the present day, access to fuel has been severely constrained. The main environmental ramifications have been artisanal oil refining and charcoal production – both coping strategies for the population. However, because of the value of the charcoal industry, and the breakdown in governance, the market is dominated by belligerents – from former combatants operating illegal kilns to the acting military officers running the operations. Against them, the ability of forest guards to police indiscretions is minimal – especially given that their monitoring infrastructure has been destroyed. The outcome of the charcoal industry is deforestation and fires – many of which are suspicious.
To meet the needs of the expanded population, coastal forest has also been cleared for, or degraded through, agricultural expansion. This is in contrast to the agricultural decline and desertification elsewhere. Much of this expansion is illegal, as is forest clearance for construction, but allowed by a weak institutional environment.
Example case – Autumn 2020
Although country-wide the number of fires and burned area was significantly down on 2019, a year associated with anomalously high crop burning, in Latakia and Tartus there was a significant increase – approximately 250% – to an all-time high on the satellite record.5
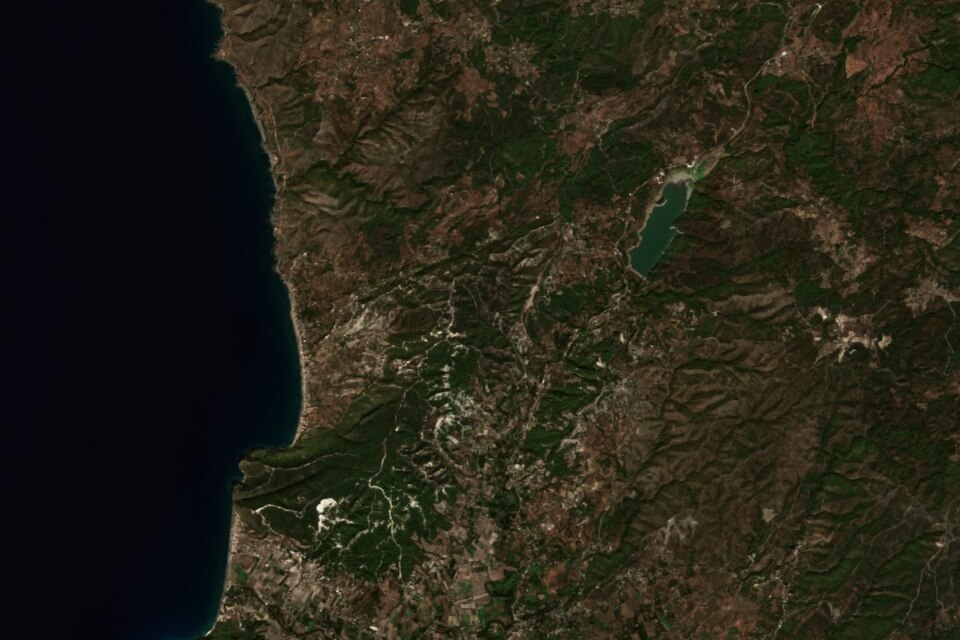
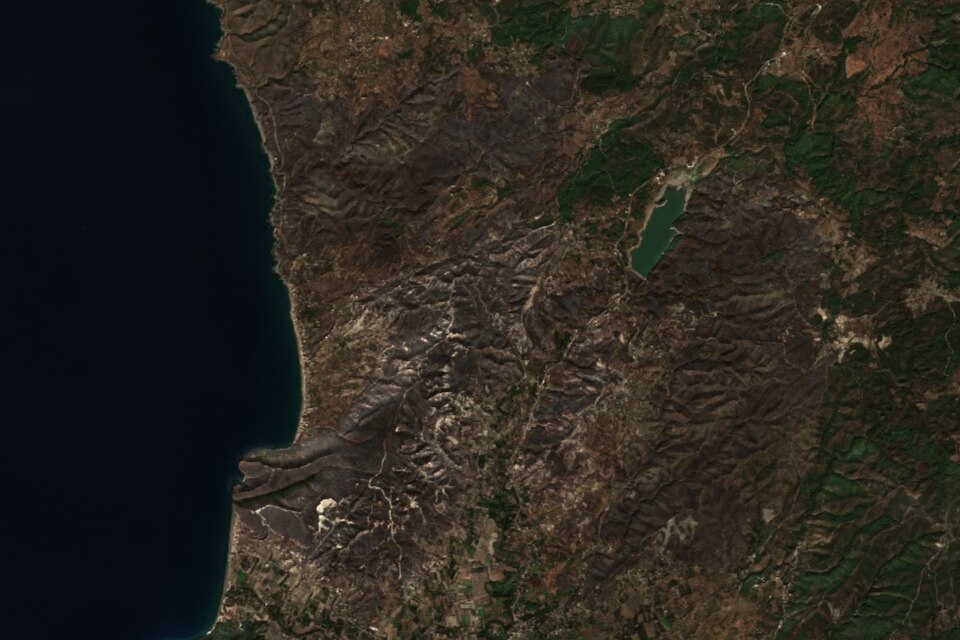
Figure 9. Before/after moderate resolution satellite imagery for example forest loss case in western Syria, in dense forest near Om al-Toyour, north of Latakia. Before image from 7th October 2020, and after image from 27th October 2020. Imagery from Sentinel-2 – contains modified Copernicus Sentinel data [2021] processed by Sentinel Hub.
Most of this fire activity occurred in September and October, with the fire scars and forest loss clear from space, as illustrated in Figure 9. The fires also caused humanitarian suffering and damage to critical infrastructure, with the large smoke plumes emitting toxic air pollutants (Figure 10). Although the meteorological conditions caused extreme fire danger, the spark for some fires was reported to be shelling, whilst residents believed others were “contrived”.
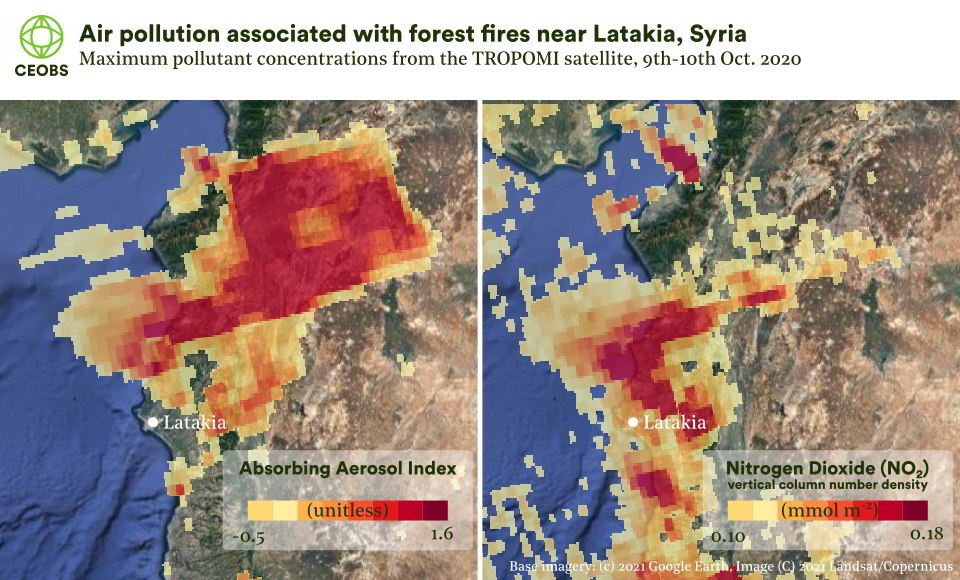
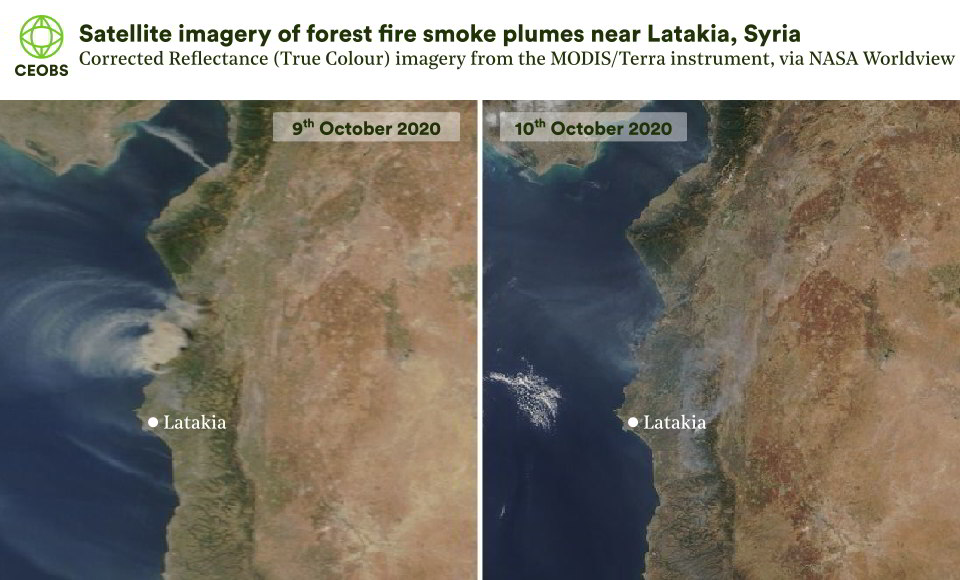
Figure 10. Smoke plumes associated with fire activity near Latakia, Syria in mid October 2020. a) Maximum values of the absorbing aerosol index and NO2 concentrations over the 9th and 10th October, from the TROPOMI instrument onboard Sentinel-5P, processed in Google Earth Engine. Credit: Copernicus Sentinel data (2021). b) Satellite imagery of smoke plumes from forest fires on the 9th and 10th October 2020, from the MODIS instrument onboard the Terra satellite. Credit: NASA Worldview. Click left/right to toggle between figures.
4. Post conflict countries
4.1 Colombia
In 2020 there was 324,000 ha of tree cover loss, an increase from 2019 and the third highest in the satellite record. Nearly half of this was in primary forest, predominantly in the Amazon, where there was a disproportionate increase compared to 2019. This pattern mirrors that of other countries emerging from conflict, which often see sharp increases in deforestation.
This acceleration of forest loss will have serious implications for climate emissions, and for Colombia’s implementation of both the New York Declaration on Forests, and the Paris Agreement – the aim for which is a 51% reduction in greenhouse gas emissions by 2030 via reducing deforestation and mass tree planting by 2022.
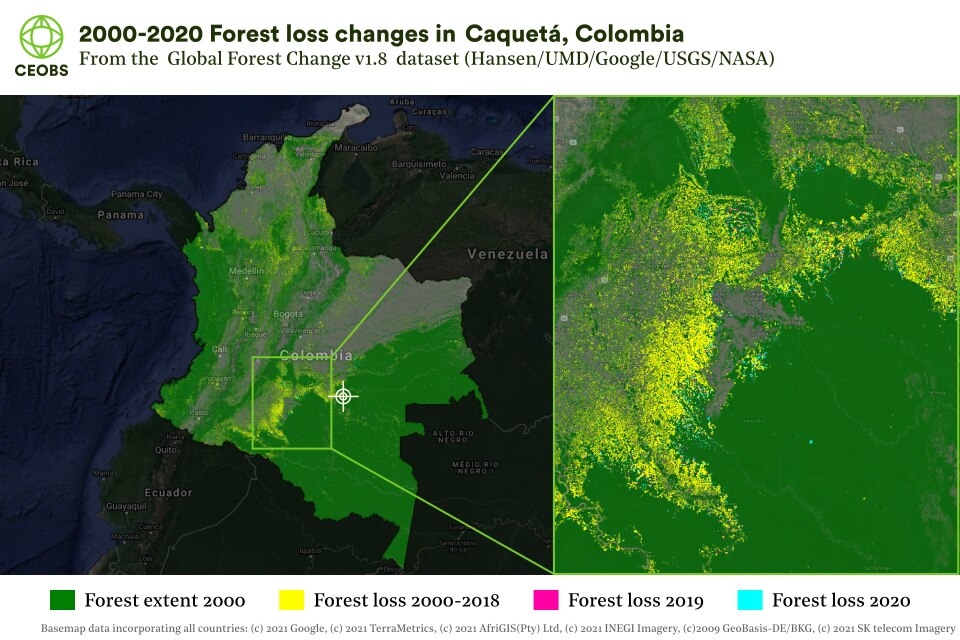
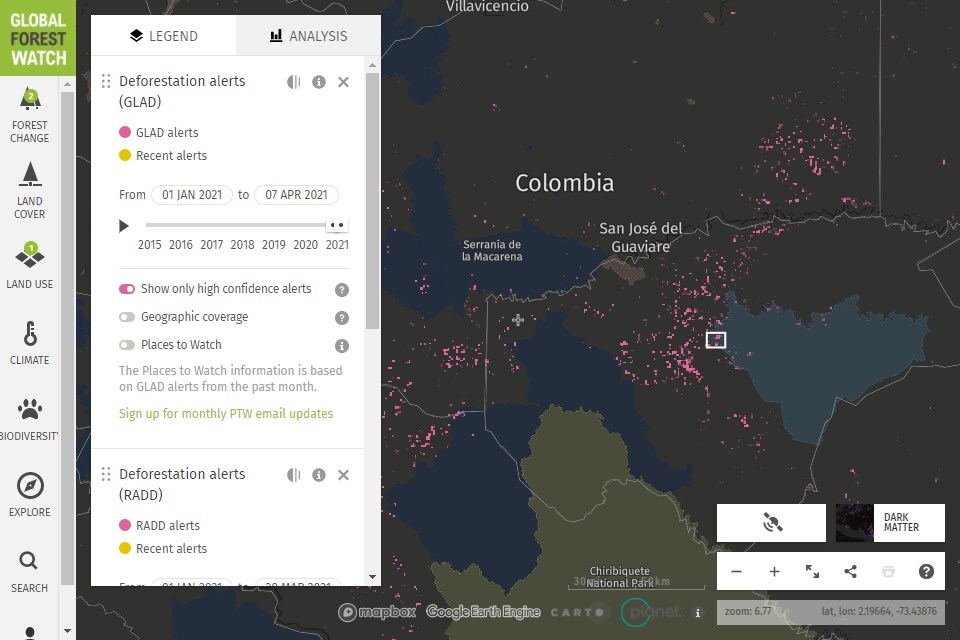
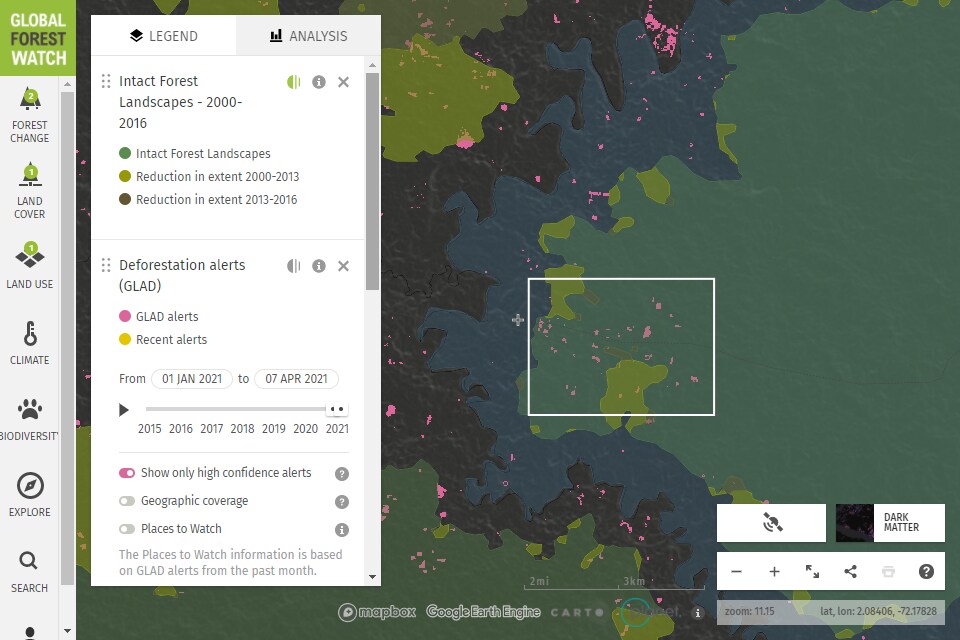
Figure 11. a) Forest loss in Colombia based on the Maryland dataset. The white target indicates the location of the example case. b) GLAD and RADD deforestation alerts from eastern Colombia since January 2021, with protected areas overlain. c) A zoom into the example case area, showing deforestation alerts within the Nukak National Nature Reserve, also with the intact forest landscapes layer – showing the case area was classified as intact forest. (b) and (c) are from the Global Forest Watch platform and the white box highlights the bounding box of the example case in Figure 12. Click left/right to toggle between figures.
Drivers of forest loss
During the conflict, the FARC operated as a de facto state authority with rules,6 regulations and landmines over swathes of untouched forest – areas that have now been opened up for exploitation. The void has been filled with a diverse range of actors seeking fast money, including criminal gangs and guerrilla groups of FARC dissidents. This has led to further violence, death and displacement for local populations, particularly indigenous groups, and 2020 saw a record number of attacks. Furthermore, social leaders, NGOs, park rangers and corporations are targets of intimidation and violence. Colombia is the most deadly country for environmental leaders and defenders – with at least 284 assassinated in 2020.
It is estimated that 70% of Colombian deforestation is related to land grabbing by illegal groups for illicit activities of pasture creation, coca cultivation, logging, mining, and land speculation. The areas with the greatest levels of deforestation coincide with the most violence, criminal activity and displacement. This includes within Protected Areas – a recent study found that, following the peace-agreement, the deforestation rate increased by 177% for the majority (31 out of 39) of Protected Areas. Speaking to Phys.org Peter Kareiva, one of the study’s authors, summarised it thus:
“We’ve long known that poor governance, corruption and lack of enforcement can undermine conservation, but in most cases the damage happens incrementally, land parcel by land parcel, each year. In this case, it was like a light switch turning on and off. It was almost instantaneous.”
During the conflict, coca financed wages and weapons for the FARC and ELN,7 and for paramilitaries. This has continued following the 2016 peace agreement but with new actors in the form of Mexican cartels. However, each extra hectare of coca cultivation is now associated with more deforestation. This includes rapid expansion into Protected Areas, such as the Catatumbo Barí and Chiribiquete national parks in the northeast.
COVID-19
COVID-19 lockdowns during 2020 are likely partly responsible for the increased deforestation rates – particularly of primary forest. There has reportedly been a decrease in monitoring and enforcement, both from the state – which is focused on combating the pandemic – and international watchdogs. There has also been an increase in fire activity during the pandemic
In ten national parks, staff of the National Nature Parks of Colombia (PNN) have been forced to abandon their posts due to violence and threats from armed groups. Moreover, tactical land clearances of just one hectare at a time have evolved in order to evade detection.
There have also been external drivers, with the global economic crisis driving up the gold price and making mining more lucrative. To exert control over disputed territories, armed groups have imposed curfews under the guise of sanitary measures – also making the intimidation and abuse of social and environmental leaders easier.
In response to the growing coca production, the Colombian government is on the cusp of restarting aerial fumigation of coca plantations with the herbicide Glyphosate. Such flights were suspended in 2015 given the toxicity of the chemical to humans – the effects on primary tropical forest are uncharacterised.
Impacts of forest loss
Deforestation has taken its toll on biodiversity in Colombia, the second most biodiverse country in the world. For example it has the greatest number of bird species, with habitat depletion posing an extinction risk to some, and threatening the wider functioning of ecosystems. Deforestation and the associated power shifts have also reinforced the unequal access to land and water for Colombia’s landless peasants. Furthermore, there are often adverse health outcomes for the campesinos, through exposure to smoke emissions or heavy metals like mercury following artisanal mining.
Lessons to learn
In many ways Colombia represents an opposite story to the other areas covered in this report – deforestation has followed peace, not preceded it. That said, this is not a unique outcome, with a similar pattern seen in Nepal, Sri Lanka, Ivory Coast and Peru. Further, it must be noted that overall, the conflict phase still exerted a negative impact on its forests. Indeed, the recent deforestation illuminates the underlying causes of the conflict, and which were perpetuated by it – highly unequal access to land, with the majority of cropland held by a small landowning elite. As such, there are surely lessons to be learnt so that when peace arrives in other locations, it too is not accompanied by an acceleration of deforestation and the seeding of further insecurity.
Colombia is also somewhat different in that it receives a high level of attention from academics, governments and NGOs, both internationally and domestically. There is a body of expertise and finance that can be called upon, but this needs to be leveraged with political will and shrewdness. Reflecting on the political landscape, recent ministerial appointments may not be positive, and the public rhetoric on sustainability is not matched by actions. With the aim of improving environmental governance and legality of natural resources, the ‘Environmental Governance for Peace in Colombia’ conference was held in March 2021, and session videos are now online.
Example case
Within the Nukak National Nature Reserve and on an area of relatively intact forest, deforestation can be seen between December 2020 and March 2021. The reserve lies within the Amazon and is home to the indigenous Nukak nomadic tribe, who remain at risk of extinction. The forest clearance is characterised by many small plots of one hectare or smaller.
Coca production in the area is increasing, encouraged by ex-FARC members. The military is actively spraying coca areas with Glyphosate (by hand), forcing producers to move to new land and disengage from attempts to transition to the production of alternative crops. In March 2020 the reserve was hit by significant fire activity and again blame was attributed to large deforesters, who aim to grab land and use it for livestock and coca, linked to cartels. In this case study, satellite fire hotspot data indicates that fire was also used in the clearance process.
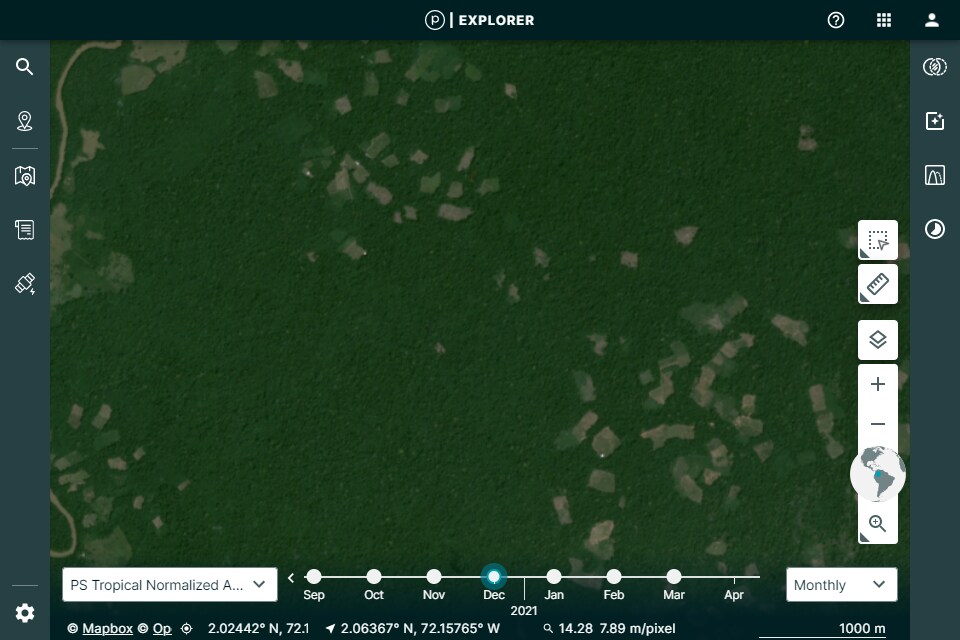
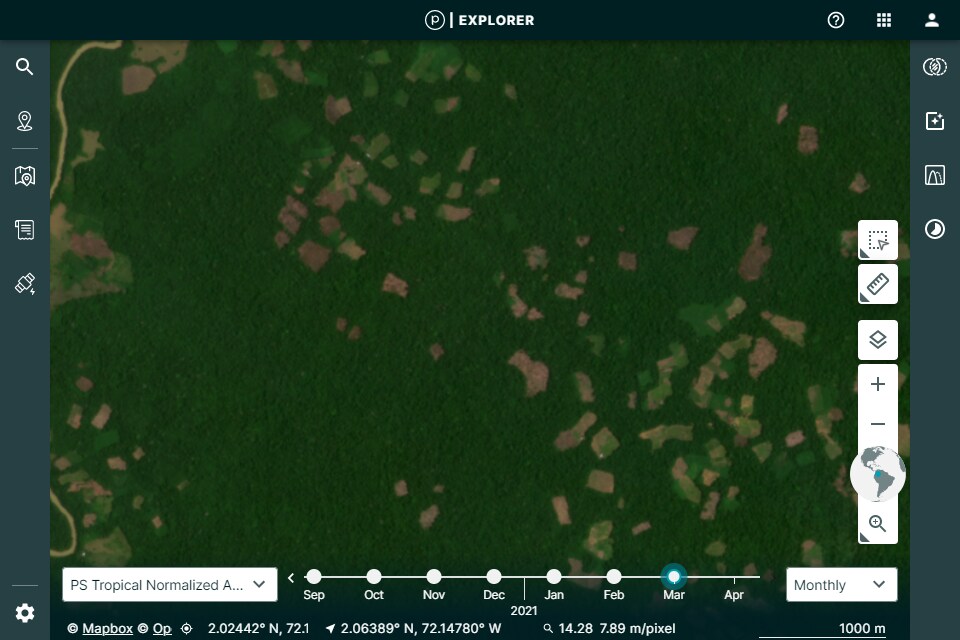
Figure 12. Before/after high resolution satellite imagery for example forest loss case in Colombia. Cloud free imagery mosaics from Planet.
4.2 Senegal
Illegal logging of endangered rosewood – the so called “ivory of the forest” – has been rife in Casamance, Senegal for the past decade – despite a lasting ceasefire agreed in 2014. The practice started in rebel areas, protected by landmines and enabled by a climate of fear, but has since expanded to include the wider populace coping with the conflict-ravaged economy. The destination for the timber is typically China, where there is an insatiable demand for antique-style furniture and, as Senegalese exports are banned, the trade has been routed through its neighbour The Gambia – a country that decimated its own Pterocarpus erinaceus or ‘keno’ rosewood stocks.
The story of this illicit rosewood extraction was exposed in a detailed investigation by the Environmental Investigation Agency (EIA). They found that approximately 1.6 million trees had been removed in Senegal and smuggled into The Gambia between 2012 and 2020 – a trade largely controlled by the MFDC rebel group,8 but also enabled by the Senegalese army, high level Gambian officials, shipping lines and Chinese timber traders. Incredible footage of the trade was captured by the BBC in March 2020.

Figure 13. a) GLAD Forest loss alerts over the past 12 months. b) Forest loss in the Ziguinchor region of Senegal, 2001-2020. Graphics from the from the Global Forest Watch platform.
It was hoped that the release of the EIA report would stem the flow of rosewood, but a November 2020 report by Mongabay suggested the trafficking had not abated but had instead been driven further underground. Moreover, a continuation of logging was reported, in response to the deteriorating economic situation. There were weeks of well above normal forest loss alerts in November and December 2020, as seen in Figure 13. There have also been accusations from Gambian civil society in January 2021 that the practice is still ongoing, although this may be the export of stockpiles.

Figure 14. Forest loss in Senegal based on the Maryland dataset.
In short, there seems to have been little response to the EIA report, despite it leading to one of the main shipping lines suspending exports, nor in response to a new Chinese forest law. The trade may also recommence in neighbouring Guinea-Bissau, if a logging moratorium is lifted.
Tree cover loss was the greatest in the satellite record in 2020 – the 758 ha lost was nearly double that of the next highest year on record (2017), and nearly all located in the Ziguinchor district of Casamance (Figure 14). The landscape in Casamance is dry forest – in contrast to the dense humid forests in the other countries discussed in this report – and the selective logging of rosewood is not always clear on satellite imagery. Indeed, the role of rosewood deforestation in 2020 versus clearance of other woody vegetation for fuelwood is not clear, and more detailed analysis is required.
4.3 Vietnam
With much more time elapsed since the fighting ended in Vietnam, what have the lasting effects of the conflict been on forest cover, and what can be learnt to help other post-conflict countries?
The war itself had a significant impact on forest cover – the profligate use of chemical defoliants and mechanical clearance had the sole aim of eliminating forest cover. The scale of the associated forest loss is uncertain – estimates range from 14-44%. There also remains a legacy from explosive remnants of war, which ironically may now be providing some protection. The impacts of these long-term forest losses are recently been felt, and are seen as the major contributing factor to recent landslides and record-breaking flooding.
Forests economic importance
Following a decision to transition to a market-driven economy in the mid-1980s, there was a boom in acacia, rubber, coffee and cassava plantations and so forest cover rose.9 This is characterised as reforestation, and whilst it has economic and some ecosystem service benefits, the monoculture plantations will be ecologically and carbon poor. Nonetheless, an estimated 4.2 million ha of forests have been planted, roughly a quarter of all Vietnam’s forests.
Driving the increase in plantations has been the accelerating marketisation of the economy and concentration of land. The timber trade is important to Vietnam and is the second largest in Asia – in 2019 the country exported $972 million of timber products to China alone. Despite an initial COVID-19 related slow-down in the trade, with fears for the economic fallout, there was a quick rebound and then acceleration – by the end of 2020 export revenues of $13.23 billion were up nearly 20% on 2019. This is somewhat consistent with the 5% increase in forest loss across the country documented by the Maryland dataset, but supplemented with the import of timber.
Indeed, Vietnam has effectively exported deforestation – often illicit and unsustainable – to other countries in South East Asia and Africa – in particular Laos, Cambodia and Cameroon. As the government wants the timber sector to grow more, but with import prices up this may put more focus on imports from less regulated locations, or pressurise native forestry. The Maryland data suggests nearly 15% of the forest loss in 2020 was of primary forests, up 6% on 2019 and reversing the trend of decreasing primary forest loss since 2016. There is little information on the state of secondary natural forests.
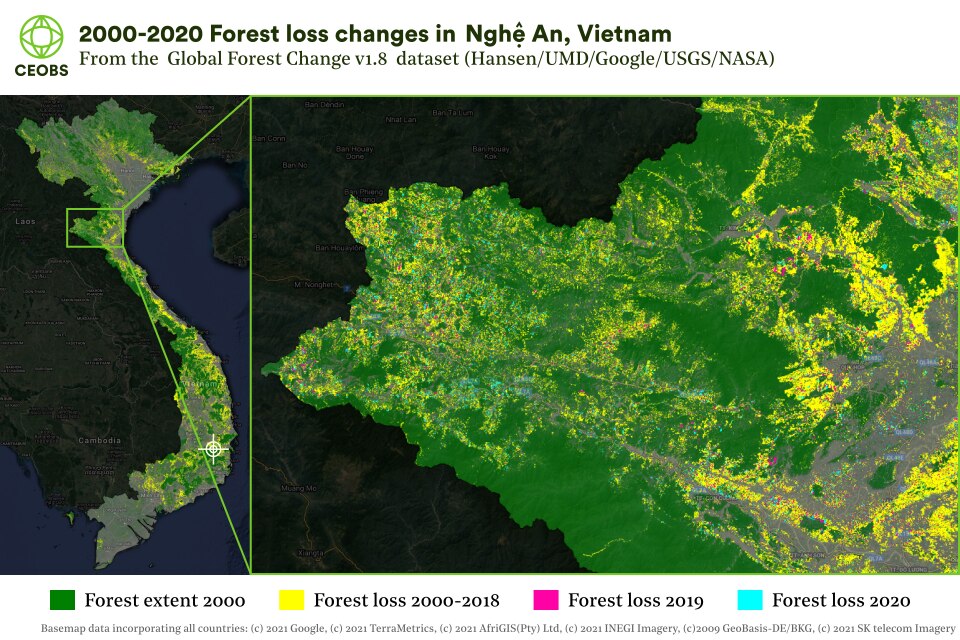
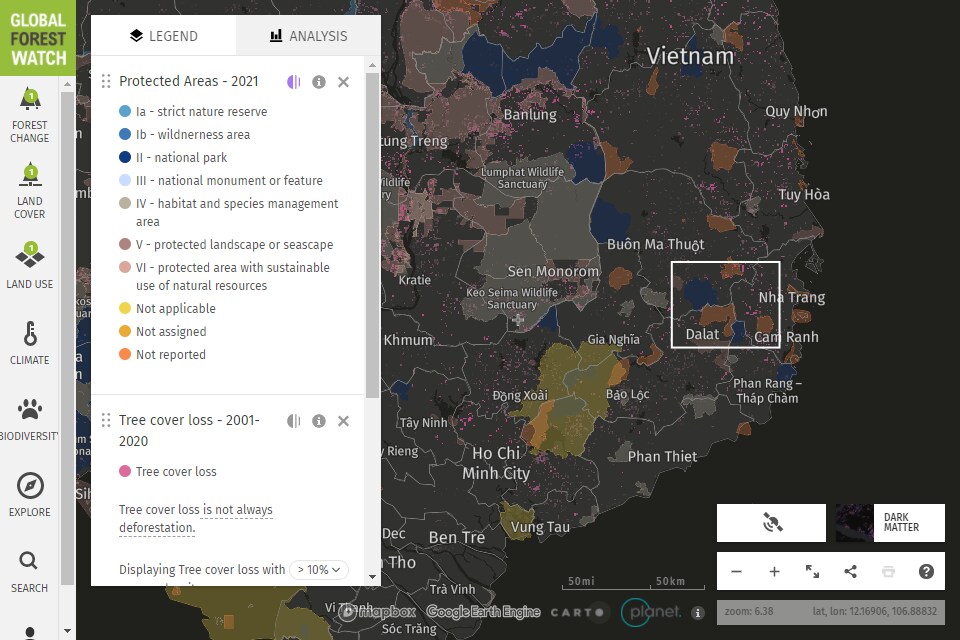
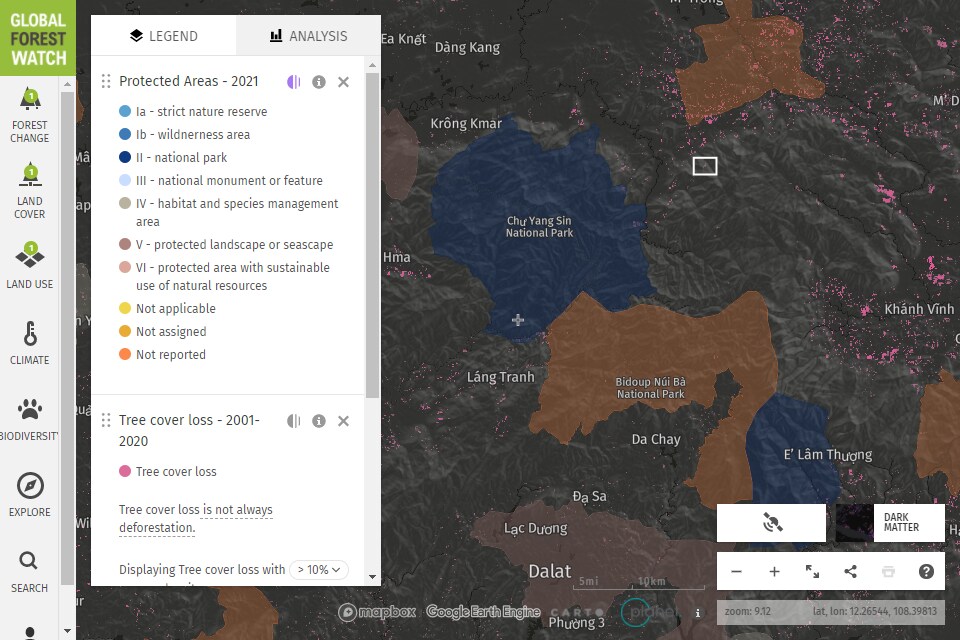
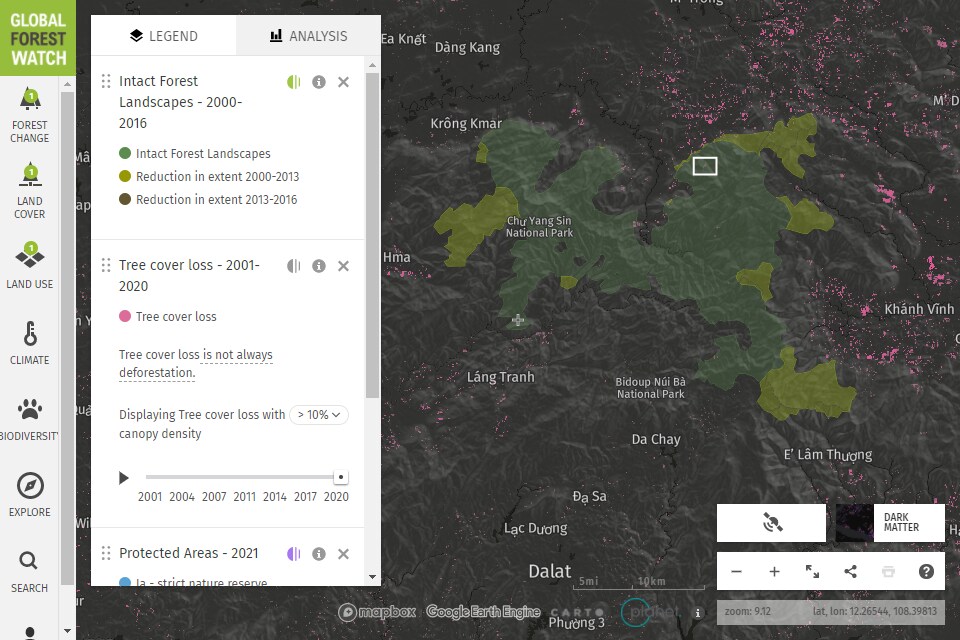
Figure 15. a) Forest loss in Vietnam based on the Maryland dataset. The white target indicates the location of the example case. b) Tree cover loss in 2020 with Protected Areas overlain. c) A zoom into the example case area, showing it is not within a Protected Area d) but it is within what was an intact forest landscape. (b), (c) and (d) are from the Global Forest Watch platform and the white box highlights the bounding box of the example case in Figure 16. Click left/right to toggle between figures.
Forest governance
Given the importance of the timber industry, and in recent decades the associated climate benefits, the Vietnamese government has been mindful of the need to protect forestry. During the liberalisation in the late 1980s and early 1990s, forests were classified either as special use (national parks), protection (watersheds or storm barriers), or production (for industry). This reflected a change in approach from the exploitation of forests to nature conservation.
Whilst the “special use” forest area has remained stable, there has been a decrease in “protection” forestry at the expense of “production” forests – despite the ecosystem services and rich biodiversity associated with the protection forestry. Further, biodiversity and forest quality has declined within special-use forests – in part, because there has been little economic alternative for communities in these areas. To counter this, the Vietnamese government has introduced co-management for joint stewardship and devolution to communities – these are projects operating over long timescales and their success remains uncharacterised.
A more immediate policy change has been the introduction in 2010 of Payments for Forest Environmental Services (PFES), including prevention of forest loss and degradation. The scheme is now firmly entrenched as policy, although the outcomes have been variable. Qualitatively PFES has increased forest quality, according to local perceptions, but quantitatively it has made little difference to forest area – although deforestation moderately declines where more organisations are involved. However, there are instances of continued payments even where forest areas have declined, and these threaten to undermine the system. The scheme is set to expand to make polluters pay, despite its variable success.
Example case
This example case is within an area of dense forest in southern Vietnam, between the first half of 2019 and the first half of 2020. The location was defined as intact forest as of 2016, but was not part of a national park – perhaps indicating gaps in the designation of special use forest.
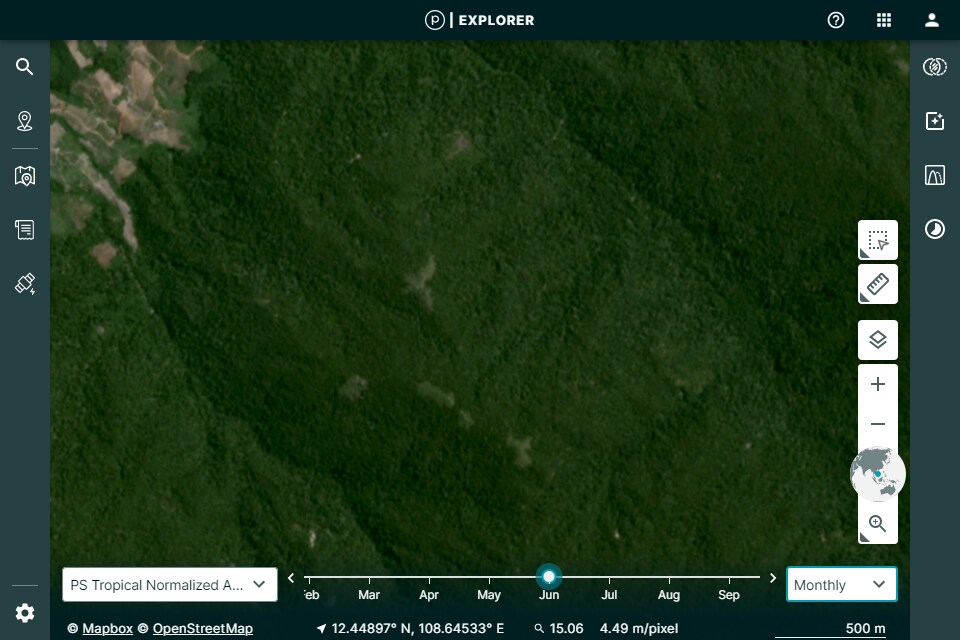
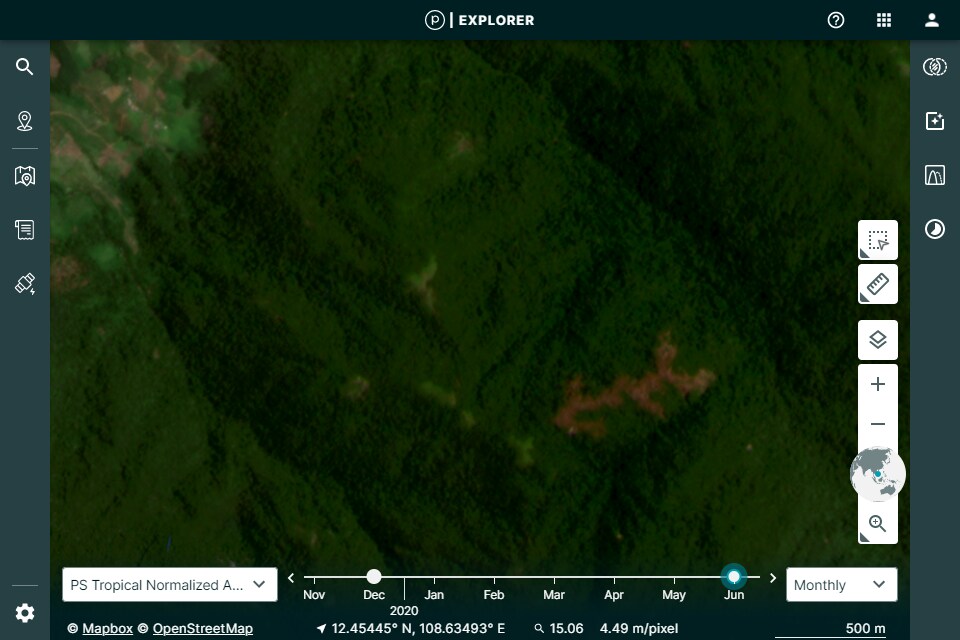
Figure 16. Before/after high resolution satellite imagery for example forest loss case in southern Vietnam. Cloud free imagery mosaics from Planet.
Forests and climate change
Vietnam has built relationships with international partners and was an early adaptor of the UN REDD+ programme in 2008 and, whilst the success has been mixed and the business case unproven, in 2018 the country became eligible for payments. Vietnam also receives finance from USAID for the PFES scheme, signed reforestation pledges at COP18, and recently unlocked money from the World Bank to reduce forest carbon emissions.
Reforestation is seen as a key national strategy to protect against climate change, especially the restoration of mangroves to protect low-lying coastal areas such as the Mekong delta. Indeed, there is great promise in Nature-based Solutions (NbS) to help mitigate, or adapt to, climate change. However, where they are used in a forestry context, great care is required to ensure they are not at the cost of carbon rich and biodiverse ecosystems.
Explosive remnants of war
A legacy from the Vietnam War, an estimated 800,000 tons of unexploded ordnance (UXO: landmines, bombs, cluster munitions, and abandoned ammunition) remains uncleared over 6 million ha, accounting for 19% of the country’s total area. A crude visual comparison suggests a correlation between areas that suffered bombardment and have since been demined, and which were covered in natural forest in 2000 and have since been converted into plantations.10 Anecdotally, there are reports of UXO clearance leading to land conversion and forest loss. In reality, the situation is likely to be complex, perhaps following different narratives entirely. However, given the role of forests in providing sustainable local livelihoods, storing carbon and sustaining biodiversity, more work is needed to understand this relationship between UXO clearance and deforestation. Along with the universities of Edinburgh and Leeds, CEOBS will help a PhD student investigate this issue in relation to carbon storage.
It should be noted that this relationship is not just an issue relevant to Vietnam, but also to many other post-conflict locations, where landmines and explosive remnants of war may be protecting globally significant primary forests. The scale is simply not known, owing to quality, coverage and management hurdles associated with demining data. The only existing information suggests the area covered could be in the order of one or two percent of remaining tropical forests,11 and thus warrants further investigation. Instead of forest clearance occurring post land release, the humanitarian mine action sector is already looking at NbS, which hold great promise.
Lessons to learn
The importance of forests for the economy and climate are key issues facing other conflict countries. They can be competing or complimentary interests, depending on management policies. In Vietnam, there has been vast reforestation, which has been a qualified success. The monoculture plantations do not offer the same carbon or ecological benefits, whilst it has led to the development and growth of a timber industry that now relies on unsustainable deforestation in other countries. Nonetheless, the plantations – especially when managed by smallholders in an efficient way – can sustain livelihoods and help reduce pressures on native forests. The success of payments for ecosystem services is an open question.
Vietnam has been quick to engage with the international community, with the high-level aim that its forestry is sustainable, and was progressive at the time in acting to create Protected Areas. These programmes have had mixed success, but the intention is to be lauded. How applicable the lessons from Vietnam are remains to be seen, especially as such involvement requires strong governance. For example, neighbouring Cambodia has followed a different path, despite some shared similarities. The forest history in Cambodia is complex, with its post-conflict journey told in a compelling recent report by Global Initiative – still today, as much as 90% of timber is harvested illegally and much deforestation occurs within protected areas.
5. Conclusion
Deforestation is an ongoing concern in many conflict-affected and post-conflict countries, with many of the drivers linked to the conflict either directly or indirectly. These drivers are diverse, but common amongst them is that they are allowed to flourish in a weak institutional environment, and are often rooted in socio-economic hardship. This includes forest removal for firewood or charcoal, clearing land for shifting agriculture, and involvement in the illicit logging trade. This environmental degradation can have lasting humanitarian consequences – for livelihoods, health and Disaster Risk Reduction.
More in-depth research is required to map the conflict-deforestation relationship in more detail, in order to break the link by promoting economic alternatives to deforestation in conflict areas. The first component of this is better forest data – whilst the Maryland dataset is powerful, it does not provide information on degradation, selective logging or smaller forests. The public release of the high-resolution satellite imagery, as funded by NICFI, will help to plug this data gap over the coming years via academic, NGO and citizen monitoring efforts. Data from the ground is important, not just to verify the satellite data, but also to help answer the second component of the research requirement – information on the drivers of forest loss and the needs of the communities within forests.
Nonetheless, in general forests across conflict-affected areas can be protected by changing value systems, from timber to alternative livelihoods, or sustainable harvesting, for example of non-wood forest products, all underpinned by community management and NbS. There is hope for such outcomes, in particular for South Sudan, which has the potential to sustainably use its tropical rainforest if capacity and financial barriers can be overcome – support is needed from the international community in order for it to do so.
There are also lessons to learn from some post-conflict countries. This includes avoiding the spikes in deforestation in the ungoverned spaces that opened up in Colombia following the peace deal. It is thus critical to restore and support post-conflict forest management, one example of which is Liberia’s post-conflict forestry compliance and enforcement handbook. But as Liberia’s experience shows, a legal and policy framework is not enough on its own, good governance and addressing the underlying drivers of deforestation, such as land rights, are also vital. Vietnam has been relatively successful in reforestation post-conflict, although this has potentially created a timber industry that now threatens forestry elsewhere. The aim ought to be hitting the sweet spot where forests are sustainably managed with significant economic, livelihood and climate contributions, with the right trees planted, or allowed to regenerate, in the right locations.
Dr Eoghan Darbyshire is CEOBS’ Researcher.
- Based on the 0.7245 ha pitch size at the home of football, Wembley Stadium
- Reducing emissions from deforestation and forest degradation.
- The Environmental Investigation Agency (EIA) has been involved in improving Myanmar’s logging industry and investigating corrupt practices – we recommend their podcast for more detail on the situation on the ground.
- There have been recent arrests for illegal logging of teak near the Ugandan border, whilst a UNSC report in 2020 detailed the role of a Ugandan company logging illegally but under the protection of the Army (The South Sudan People’s Defence Forces)
- Based on our calculations of burned area using the MODIS Burned Area Monthly Global 500m MCD64A1.006 product.
- Fuerzas Armadas Revolucionarios de Colombia/Revolutionary Armed Forces of Colombia
- Ejército de Liberación Nacional / National Liberation Army
- Movement of Democratic Forces of Casamance/Mouvement des forces démocratiques de Casamance
- Cassava is used to produce animal feed, biofuel and noodle flour
- This is based on our analysis of US Theater History of Operations (THOR) data overlaid onto global forest cover maps in 2000, the forest loss 2000-2020, and publicly available information on demining activity (e.g. for Quang Tri province here). Because the relationships are not well understood, we do not present this analysis here.
- Primary tropical forests cover around 14,500,000 km2. It is estimated that globally 900,000 km2 of land has been degraded or made inaccessible as a result of ERW and landmine contamination. If we conservatively assume that 15-35% of this area is in tropical forests, it represents 1-2% of the total. We have very little constraint on this number, it may be a large overestimate – we simply do not know without further study


